
We used machine learning to predict cause of death from free text summaries of those diagnosed with prostate cancer; and the presence of bad practice in health and social care for those who have died with learning difficulties.
Aims
Knowledge of underlying cause of death (UCoD) is a key health outcome in research and service improvement but is not always accurately recorded. Likewise, the identification of bad practice is also vital to understanding health outcomes in the population and improving health care provision.
We have applied machine learning (ML) classifiers to over 4,000 death reviews (free text summaries), from the Cancer Research UK Cluster randomised trial of PSA testing for prostate cancer (CAP) and Learning Disability Mortality Review programme (LeDeR). Each review was assigned a label – either prostate cancer death or poor health–care practice by independent experts. This expert assignment was used to train the ML techniques to:
- Identify the key elements (words and phrases) that are good predictors of
- Prostate cancer death or
- Poor health– or social-care practice
2. Add user confidence by explaining how the ML techniques work, rather than solely relying on the prediction probability that is output by the classifier. In this sense we add transparency to the ML.
We developed the methodology using data from the CAP project, and subsequently applied it to the LeDeR data to test how well it could generalise.
Results
The first step was to build a tool to predict prostate cancer death from the free text summaries. Using a random forest (RF) classifier with a bag-of-words feature set we found that we could predict prostate cancer death with >90% accuracy. We then investigated how the RF was classifying the free-text summaries by looking at which elements in the free-text summarises were used by the RF to assign prostate cancer death. To do this we investigated a variety of potential visualisation techniques:
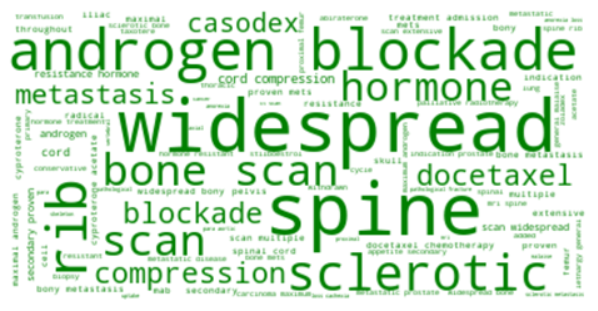
Word clouds
Word clouds provide a visual representation of the words (or group of words) that are most predictive of prostate cancer deaths across the dataset. The word clouds show that clinically important signs of progressing prostate cancer, are key to identifying prostate cancer deaths.
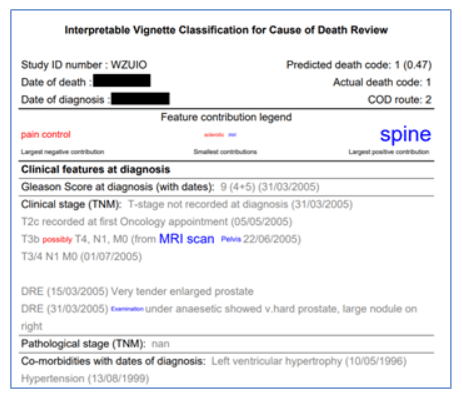
Interpretable text-outputs
We also used both tree-interpreter and LIME to identify which words contributed most to any given classification. We then visualised these contributions by formatting the original free-text summary to indicate which text elements contribute to the classification, so that the classifier’s decision can be understood by a human reader.
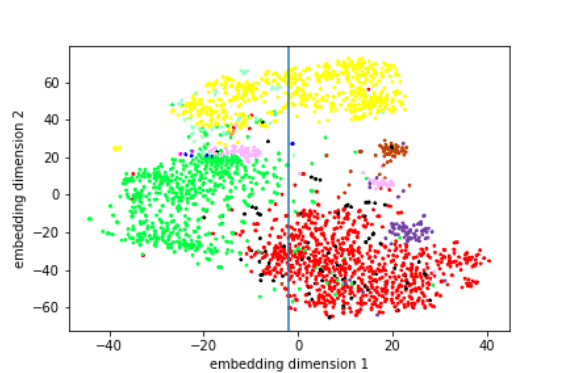
Writing style
Using free-text is dependent on the quality of the text, which can influence the performance of ML techniques.
These visualisations use the t-SNE algorithm to show clear clusters of free-text summaries that contain similar elements. Here we can identify the three main clusters, where the summaries share commonalities in style, and represent three different authors, where each author is presented by a specific colour. This analysis even brought the authorship of some reviews into question (note the two separate pink clusters, which appear to be so divergent in this data representation).
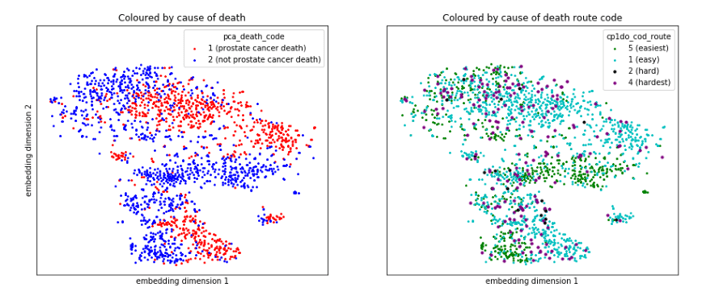
Hard vs Easy cases
Cases where there was disagreement between the panel of experts about the cause of death are potentially the same cases where the ML classifier is less certain of the prediction. Figure 4 illustrates that the cases the expert panel found “hard” to assign cause of date (purple and black points in the right hand panel) often sit in the location where prostate cancer (red) and non-prostate cancer deaths (blue) meet in the left hand panel. This is a space where the ML techniques are less certain about when predicting cause of death. This is confirmed by figure 5, which shows that the classifier performs much worse on the ‘hard’ cases than the ‘easy’ cases.
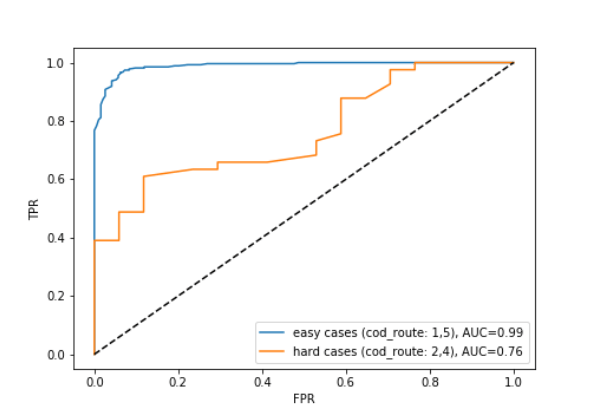
The classification of ‘hard’ cases appears to be a more difficult task and we have yet to produce a classifier with good performance for this purpose. It could be that we need to engineer additional features from the reviews to successfully predict hard cases. Also, natural language elements, such as negation or hedging terms are notoriously difficult to detect but may improve performance at this task.
Generalising to LeDeR
Our methodology was successfully applied (see figures 6 and 7) to the LeDeR dataset, which contains more verbose reviews and a much larger number of authors. The ability of the method to generalise to this challenging dataset validates our approach and encourages us to further develop the approach for application across new domains in the future.


Future plans for the project
This exploratory project has identified several avenues for further development. Notably, we have developed Python code that can predict prostate cancer deaths from free-text summaries, and demonstrated its application to a second dataset (LeDeR). This documented code will be shared on GitHub to allow others to apply our methodology to their data.
Future work will focus on developing use cases for applying this methodology. For instance, gaining understanding of the textual elements that are key to decision making could be used to:
- Provide decision support for identifying prostate cancer deaths or poor healthcare practice, reducing the need for clinical experts to review free-text summaries.
- Identify the important elements of the free-text summary for the authors to target the key sections of the medical history, which would speed up the data collection.
The ability to accurately predict hard cases would help to allocate reviewer resource more efficiently and so is a strong candidate for further development. We are also keen to produce a dashboard that would allow users to interactively explore their own datasets using the methods we have developed. We are exploring external funding opportunities to continue this project and are writing up our results for publication in a special edition of Frontiers in Digital Health.
Contact details and links
Dr Emma Turner, Population Health Sciences
Ms Eleanor Walsh, Population Health Sciences
Dr Raul Santos-Rodriguez, Engineering Mathematics
Dr Chris McWilliams, Engineering Mathematics
Dr Avon Huxor, School of Policy Studies
Methods derived in part from: FAT-Forensics toolbox
Jean Golding Institute Seed Corn Funding Scheme
The Jean Golding Institute run an annual seed corn funding scheme and have supported many interdisciplinary projects. Our next round of funding will be in Autumn 2020. Find out more about our Funding opportunities