
Transferring early disease detection classifiers for wearables on companion animals
Axel Montout, Andrew Dowsey, Tilo Burghardt, Ranjeet Bhamber, Melanie Hezzell and Emily Blackwell
Introduction
Sensor-based health monitoring has been growing in popularity as it can provide insight into the wearer’s health in a practical and inexpensive way. Accelerometer-based sensors are a popular choice and have used been for various applications, ranging from human health to livestock monitoring.
Aim of the Project
This project aims to predict early signs of degenerative joint disease (DJD) in indoor cats with the use of accelerometers and machine learning techniques.
Methodology and Results
Dataset
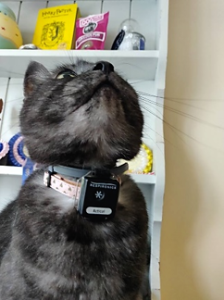
Data points originating from a study investigating DJD in cats were used in this project1. Fifty-five pet cats were equipped with a wearable sensor that collected accelerometery data over a continuous 12-day period.
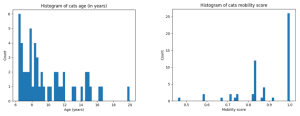
The Raw data comprised of 57 MS Excel spreadsheets containing the sensor data, along with a metadata spreadsheet, which described the age and joint health of each individual cat, and included an owner-generated mobility score (evaluated by the owner in a series of questions asking them to report changes in the mobility of their cat).
Out of the 57 sensors, five were set up to measure activity counts every millisecond, while the rest collected activity counts every second. For this project, all the activity data were resampled to the second resolution (i.e. each count contains the sum of activity counts within each second) if it was not already at that resolution.
Samples
Using supervised machine learning (SVM)2 requires the building of samples which are composed of an array of features and a ground truth value, which is the value we want to predict. In this case, we decided to solely use activity counts as features and the health score as ground truth.
Accelerometry data for three of the cats were excluded from further analysis, as their respective sensors were calibrated differently compared to the rest of the cats. Although postprocessing approaches could tackle such an issue, this was done as a safeguard to avoid biasing the analysis.
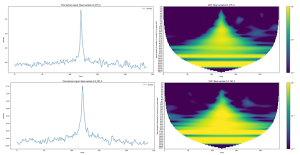
Given the limited number of cats (55), we decided to build multiple samples out of each individual cat. We hypothesised that the effect of degenerative joint disease would reflect more in the activity of a cat when it is performing higher activity behaviour such as jumping, quick running etc. For that reason, we created samples by looking for peaks of activity in each cat trace and selecting a fixed amount of activity data before and after the peak occurred, effectively building a window around the peaks. We fixed the window length to 4 minutes, or 240 seconds, and selected the top 0.001% of peaks, based on the activity count value. With this approach, we were able to generate 10 peaks per cat, giving a total of 550 samples.
Pre-processing
Before feeding in the dataset of peaks, the data was pre-processed (features) to optimise the predictive power of the machine learning classifier. In order to establish which pipeline was optimal, several different pre-processing pipelines were used. Here, only our ‘Baseline’ pre-processing pipeline will be discussed. We initially applied quotient normalisation to the array of activity of the sample, followed by standard scaling.
Quotient Normalisation
This prepossessing step aims to normalise the amplitude of the activity in the samples.
Standard Scaling
This standardizes features by removing the mean and scaling to unit variance. The standard score of a sample x is calculated as: z = (x – u) / s
Data Augmentation
The initial dataset was augmented (increasing the number of samples) by building permutations of peaks from the initial 550 sample dataset. Permutations of 2 and 3 peaks were built, creating datasets containing 4680 samples (2250 healthy and 2430 unhealthy) and 37440 samples (18000 healthy and 19440 unhealthy) respectively.
Machine Learning
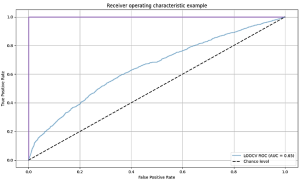
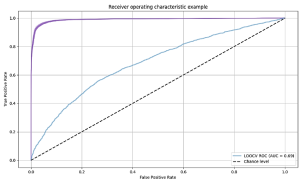
An SVM classifier (RBF kernel) was trained with the datasets described above. To evaluate the prediction performance, we used the leave one out cross-validation method, where we trained the model with all the samples in the dataset, apart from the sample from one cat, which was used for testing. This was done so that all 50 cats were tested against the rest. All samples were pre-processed by applying quotient normalisation and standard scaling before training the SVM.
Results
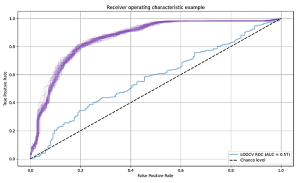
We used the area under the curve (AUC) of the receiver operating characteristic (ROC) curve to evaluate performances. For the 1, 2 and 3-peaks dataset, a testing AUC of 57%, 65% and 69% were obtained respectively. Using more than three peaks did not improve the results.
Conclusion and Future Plans
Despite the limited amount of data available, a machine learning approach demonstrated promising results in the prediction of early joint disease in cats, with the help of our data augmentation approach. These results suggest that the data within small windows, centred around bursts of activity, contains enough information to discriminate a healthy cat from an unhealthy cat. Further work is currently ongoing to determine which part of the window of activity is most important for prediction. We hope that this will provide a novel insight into how the activity traces of cats with early joint disease differ from unaffected cats, when performing movements involving high activity.
Further Information
For further information about this study please contact Dr Emily Blackwell, Emily.blackwell@bristol.ac.uk
More details about the Bristol Cats Study are available here: http://www.bristol.ac.uk/vet-school/research/projects/cats/
Bibliography
1.MANIAKI, E, Risk factors, activity monitoring and quality of life assessment in cats with early degenerative joint disease. Msc thesis, University of Bristol (2020)
2.CORTES AND V. VAPNIK, Support vector network, Machine Learning, 20 (1995), pp. 273–297.
3.DAUBECHIES, J. LU, AND H.-T. WU, Synchrosqueezed wavelet transforms: An empirical mode decomposition-like tool, Applied and Computational Harmonic Analysis, 30 (2011), pp. 243–261