Convolutional neural networks for environmental monitoring

JGI Seed Corn Funded Project Blog

Background

Environmental monitoring is critical for the protection of human health and the environment. As the world’s population continues to increase, industrial development and agricultural practices continue to expand, as does their associated pollution. The requirement for environmental monitoring is thus greater than ever, particularly for freshwater resources utilised for human consumption.

Biological monitoring of freshwater resources involves regular characterisation of dominant microalgal communities that are highly sensitive to nutrient pollution, forming widespread harmful algal blooms (HABs) during the process of eutrophication. But, traditional microscopy-based monitoring techniques to identify and count microalgae represent a significant bottleneck in monitoring capabilities and limit monitoring to institutions with highly trained individuals.

Project Aim

This project was founded to provide proof-of-concept for the application of artificial intelligence, specifically deep learning convolutional neural networks (CNNs), for rapid detection and identification of dominant microalgal groups and trouble HAB-forming species in freshwater samples.

Major actions

  1. Create robust training dataset: The first step to achieve this was to produce a robust, annotated training dataset of both controlled (i.e. mono-species cultures) and wild-type (i.e. natural) samples. A partnership with Dwr Cymru Welsh Water (DCWW) was established, allowing for the provision of water samples from their reservoirs over the spring-summer season, as well as access to their culture collections of dominant HAB-forming taxa. JGI support then allowed to recruit our intern, David Furley, who spent a month imaging and annotating images of both types of samples, with support provided from DCWW experts to ensure the highest accuracy of species identification.

Outcome 1: In total ~5000 annotated wild-type images were produced containing a variety of algal species (e.g. Figure 1), and ~3000 annotated culture-collection images, across dominant cyanobacteria, diatom and chlorophyte algal species; a major feat in such a short timeframe, well done David!

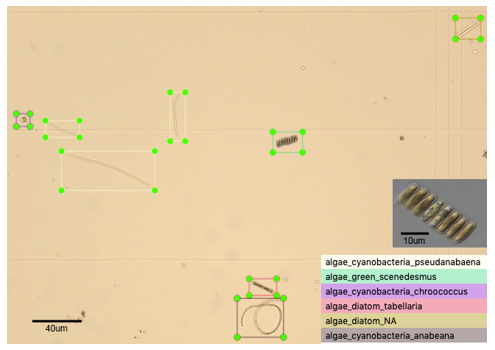
Figure 1: Representative training dataset image of microalgae found within a wild-type water sample at x100 magnification, showing bounding boxes drawn around six different genera of algae classified based on morphology and size.

  1. Test off-the-shelf CNNs for algal detection and identification: Once a robust training dataset was produced, the next step was to test the application of existing CNNs for the tasks of object detection (finding and drawing a bounding box around algal cells within images) and identification (assigning the correct taxonomic label to each object identified). For this proof-of-concept project, we chose to test a PyTorch implementation of the YOLO (You Only Look Once) version 3 CNN. YOLOv3 predicts bounding boxes using dimension clusters as anchor boxes, predicting an objectness score for each bounding box using logistic regression. The class each bounding box may contain is predicted using multilabel classification via independent logistic classifiers. The sum of squared error loss is used for training bounding box predictions, and binary cross-entropy loss for class predictions.

Outcome 2: YOLOv3 proved highly effective at object detection of microalgae within mono-specific culture images but more importantly, wild-type samples containing a mixture of algal species as well as non-algal particles. Overall, however, YOLOv3 performed less well at object identification.

  1. Test bespoke KERAS (TensorFlow) CNNs for algal identification: To build on our initial progress in algal detection, bounding boxes were used to cut algal cells from images within our training dataset, creating a second database of annotated individual algal cells to be used as input into a purely identifier focussed CNN. For this we employed a KERAS-based CNN on images comprising 3 types of algae; Oscillatoria HAB-forming cyanobacteria, Asterococcus Chlorophyte algae, and Tabellaria diatoms. Two training datasets were produced; i) a non-augmented training dataset comprising 273 images (91 from each class); and ii) an augmented training dataset that totaled ~ 6552 images (2184 from each class). Two instances of our novel CNN were then trained for 270 epochs each.

Outcome 3: Whilst the CNN trained on non-augmented images performed relatively well (Fig. 2), with identification accuracies ranging 86 – 100% across three classes of microalgae (Fig. 3), image augmentation significantly improved training outcomes, with Oscillatoria cyanobacteria identified with 97% accuracy, Tabellaria diatoms with 99% accuracy and Asterococcus green algae with 100% accuracy (Fig. 3).

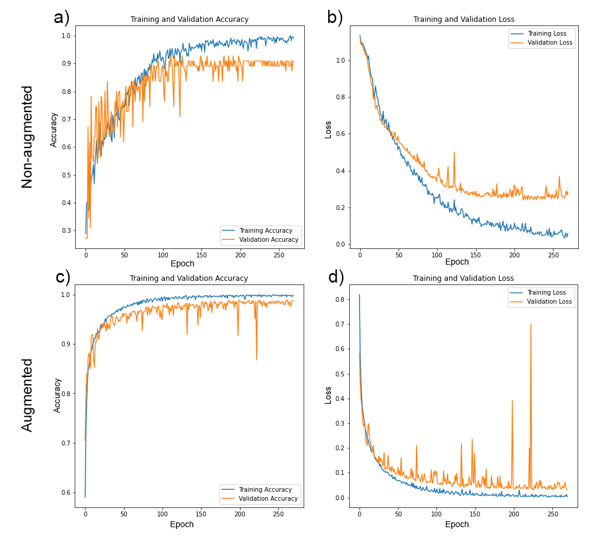
Figure 2: Training (blue lines) and validation (orange lines) accuracy (a & c) and loss (b & d) for bespoke KERAS-CNNs trained on non-augmented (a & b) and augmented (c & d) training datasets over 270 epochs.

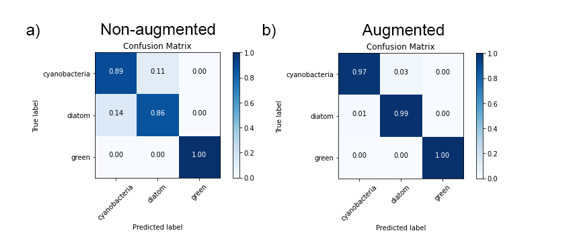
Figure 3: Confusion matrices showing classification results for validation data for our KERAS-CNNs trained on non-augmented data (a) and augmented datasets (b). Values represent percentage of correct/incorrect classifications.

Overall

This project has demonstrated proof-of-concept for the application of convolutional neural networks in the monitoring of microalgal communities within critical freshwater resources. We have amassed a sizeable, annotated training dataset of both wild-type and cultured samples, demonstrated the success of off-the-shelf CNNs in microalgal detection within images of water samples, and provided the first step on the road to developing CNNs capable of algal identification.

Future plans

Much work remains to be done on this topic before we have CNNs capable of automated algal detection, identification and enumeration from natural samples. We will continue to test different CNN architectures on our 8000 image training dataset. Collaborations with DCWW are ongoing and the outputs from this work will form the evidence base for a larger project application to drive the incorporation of CNN techniques into environmental monitoring.

Contact details:

Please contact the PI Chris Williamson at c.williamson@bristol.ac.uk and see his research group website at www.microlabbristol.org

What intensities of physical activity during adolescence contribute most to health in adulthood? – A study on the full intensity spectrum (Part-1)

JGI Seed Corn Funded Project Blog

Physical activity (PA) is among the most important human behaviours to improve and maintain health. The level of PA performed by an individual is often measured by accelerometers (the sensors used in fitness trackers or smartphones), but the obtained data is rich and evokes statistical challenges. Hence, novel statistical solutions must be found. Multivariate Pattern Analysis (MPA) could help in this regard and has great potential to provide new insights into how PA relates to health. In this first part of our 2-part blog series we describe how we will study the multivariate PA intensity signature related to early adult physical and mental health.

The problem in a nutshell

In research, accelerometers are typically worn around the hip or wrist for several days. They measure movements of the body multiple times per second and thus produce a massive amount of raw data. In general, being active will increase the measured acceleration (ie, the stored values will be higher). All values collected over the week are then used for the analysis, for example, by averaging them. This average value represents the total amount of PA performed. Another option is to look at the time spent in specific intensities of PA (eg, minutes per week of lower or higher intensity). This can be done by applying so called ‘cut points’ to the measured acceleration (the stored values). For example, if the stored value is greater than 4000, we could assume this minute was of higher intensity (those cut points are usually developed in studies where the accelerometers are compared to other measurements of the intensity of PA). Thus, cut points can be used to estimate the weekly time spent in different intensities of PA.

Many previous studies investigating associations between PA and health have focused on few intensity categories (ie, sedentary, light, moderate, vigorous). Special attention has been paid to time spent in moderate-to-vigorous PA. In fact, current PA guidelines are heavily based on this evidence. The focus on broad and selected parts of the intensity spectrum has at least two problems. First, many activities will be collapsed into the same group. For example, brisk walking and playing Squash, even though their intensity can be vastly different, are included in the same category (moderate-to-vigorous PA). Secondly, we do not know enough about the relative contribution of lower-intensity PA to health (eg, light).

However, including all the intensity categories in a single statistical model (eg, Ordinary Least Squares Regression) is problematic due to the high correlation between the variables and their closed structure (ie, summing up to 24 hours when adding sleep). Therefore, novel statistical solutions are needed to overcome these challenges and to identify the relative contribution of each intensity within the full intensity spectrum. One approach is MPA, which was, among others (eg, compositional data analysis, intensity gradient) recently introduced to the field of PA epidemiology. MPA addresses the collinearity among intensity categories using latent variable modelling (Partial Least Squares Regression (PLS-R)) while allowing for the inclusion of a high-resolution dataset (full intensity spectrum). So, instead of using the above-mentioned categories (sedentary, light, moderate, vigorous) we can not only include all the categories together but also increase their resolution by increasing the number of cut points (eg, time spent in 4000-4499, 4500-4999 instead of using just ‘4000 and greater’). Thus, single cut points (eg, 4000) are becoming less important while at the same time we can study the relative contribution of specific intensities considering all others in the same statistical model.

More information about MPA can be found here

Aims of the project

Previous applications of MPA to PA research have been cross-sectional studies on physical health (eg, cardio-metabolic health) where both the exposure (PA) and outcome (health) are measured at the same time. Therefore, the role of specific PA intensities for a broad range of physical and mental health outcomes is unknown. Moreover, given the importance of adolescence for life-course health, longitudinal studies are needed to explore the role of adolescent PA on future health. This proposed project utilises data from the Avon Longitudinal Study of Parents and Children (ALSPAC) resource, the most detailed study of its kind in the world, to provide novel evidence on associations of the PA intensity spectrum in adolescence (accelerometer measurements at ages 12, 14 and 16 years) with important adult health markers (wellbeing, depression, anxiety, cardiovascular health, metabolic health, adiposity, musculoskeletal, and respiratory health, measured at 25 years). The selected health markers are shown in the Figure below.

Stay tuned for Part-2 which will be published next year and shows the results of this project.

Contact details

Dr Matteo Sattler (Email: matteo.sattler@uni-graz.at, Twitter: @Sattler_Graz)

Institute of Human Movement Science, Sport and Health, University of Graz, Graz, Austria

Dr Ahmed Elhakeem (Email: a.elhakeem@bristol.ac.uk, Twitter: @aelhak19)

MRC Integrative Epidemiology Unit at the University of Bristol, Bristol, UK

Bristol Science Film Festival 2021 Data Science and AI winners

We are pleased to announce the winners of the Bristol Science Film Festival Jean Golding Institute Data Science and AI film prize 2021. The JGI co-hosted a screening with BSSF of the winning films in Data Week Online 2021. 

Bristol Science Film Festival runs an annual science film competition to support film-makers trying to tell the most interesting facts (or science fictions), no matter their resources.  

Winner — The Artificial Revolution 


Elyas Masrour 
A young artist investigates the recent advancements in creative Artificial Intelligence to see if we’re approaching the end of art.

Watch it here 


Runner up — Not a Robot 


George Summers 
A robot tries to break into a human facility, and is asked a security question… 

Watch the trailer here 


The Elizabeth Backwell Institute awarded a prize to health-related films in celebration of the 200th anniversary of Elizabeth Blackwell’s birth. Click here to find out more. 

More about Bristol Science Film Festival and the other category winners

The symbolic annihilation of women in primary school literature.

JGI Seed Corn Funded Project

Blog post by Chris McWilliams, Tamzin Whelan, Roberta Guerrina, Fiona Jordan, Amanda Williams.

Figure 1: (left) Tamzin scanning books, running them through the OCR software and correcting the output; (right) a child reading an early years book.

Children are strongly impacted by the gender messages they receive at a young age, and books are integral to this messaging. The goal of this project is to examine the prevalence of gender stereotypes in Early Years Foundation Stage (EYFS) book collections available in school classrooms.

Specific aims of the project include:

  1. To create a machine learning tool that will analyse both the gender of the protagonists (making a distinction between human and non-human characters) and the language associated with the different genders;
  2. Use an interdisciplinary perspective to analyse patterns revealed by word frequency extraction, to gain a better understanding of how EYFS children’s books are reinforcing or challenging gender stereotypes;
  3. To produce reusable software and data science methods that can continue to be used to identify the prevalence of gender stereotyping in book collections. The intended users are teachers, parents and researchers.

Results

Our sample consists of 200 books from the reception class of a primary school in rural Devon. As in most schools, the collection was amassed over time and the date of first publication ranges from 1978-2020. So far, 130 of the 200 books have been scanned and processed. Initial findings suggest that within this collection there is a disproportionate representation of genders and characters are depicted in gender stereotypical ways.

Figure 1.  The frequency of gender (female [F], male [M], non-gender specific [NGS]) and ‘species’ (human/non-human) of protagonists and secondary characters from 130 children’s story books.

There are two key findings to date:

  1. Gender Representation. By coding the gender (female, male, or non-gender specific) and species (human or non-human) of the protagonist and secondary characters in each storybook we were able to examine whether the genders were equally represented.

Unsurprisingly, they were not. The results are depicted in figure 1. Male characters outnumbered female characters at a rate of more than 2:1 (32% female characters in total). When females were included, they were far more likely to be represented as secondary characters than protagonists (75% of females were secondary characters, versus 52% for males).  This is important as it replicates the harmful stereotype of females occupying supporting roles.

2. Gender Stereotyping. Using Spacy to parse the sentence structure, we examined verb clauses where the noun-subject belonged to a standard list of female/male identifiers or was the name of a character with identifiable gender (manually coded).

From these sentences we then extracted the following words types and associated them with the gender of the noun-subject:

  • the verb associated with the noun subject in each sentence (Root)
  • nouns that are the object of the verb clause (Dobj)
  • adjectives associated with the noun subject (Amod and Acomp)

The results are summarised in figures 2 and 3, and in table 1 which shows that female characters have approximately half as many associated words across the three word types. This reveals a smaller vocabulary associated with female characters, suggesting that females are less relevant to plot lines and have less expansive narratives.

Figure 2: Word clouds showing the frequency of verbs associated with female and male characters.

Figure 3: Word clouds showing the frequency of nouns associated with female and male characters.

Table 1: Summary of word types associated with female and male characters. ‘Words per character’ is the average number of distinct words per character.

We are currently verifying the coding process, but initial findings demonstrate that gender stereotypes continue to be present in children’s literature. For example, verbs related to female characters are more passive, and verbs related to male characters are more active. Aligning with gender-based microaggressions, male characters tend to dominate the text, reaffirming masculinity as the norm. Female characters most frequently act on ‘him’ (table 1), indicating a centralisation of the male experience within the portrayal of female characters.  Furthermore, females predominate in caring roles with 25% of all female characters written as Mum, compared to 4% of males as Dad. This reproduces stereotypical divisions between public and private roles, situating females in the domestic sphere and males in the external world.

In summary, we find that female characters are not being represented equitably in this collection. When female characters are featured, they are more likely have minor roles and are more likely to perform stereotypically female roles.  Patriarchal socialisation at such an early age negatively impacts the way children understand society and their position within it. These findings demonstrate that through both the omission and portrayal of female characters, harmful gender stereotypes are indeed present in contemporary classroom libraries.

Future Plans

Encouragingly, there is increasing awareness that diversity and representation in children’s literature is problematic and some online resources and studies are drawing attention to this issue. In addition to expanding the dataset, developing the data science, and disseminating findings to academic audiences, we are keen to work with parents, teachers, and community partners to actually change what children are reading. This will be the foundation of a larger funding application – we look forward to updating the JGI community on our future successes in this area.

Please contact Chris McWilliams (chris.mcwilliams@bristol.ac.uk) for more information about the project.

“climatearchive.org”: 540 million years of climate history at your fingertips

JGI Seed Corn Funded Project

We created a web application that enables interactive access to climate research data to enhance scientific collaboration and public outreach. 

Screenshot of the app showing surface ocean currents (coloured by magnitude) of the present-day Atlantic Ocean.

Climate model data for everyone 

We can only fully understand the past, present and future climate changes and their consequences for society and ecosystems if we integrate the expertise and knowledge of various sub-disciplines of environmental sciences. In theory, climate modelling provides a wealth of data of great interest across multiple disciplines (e.g., chemistry, geology, hydrology), but in practice, the sheer quantity and complexity of these datasets often prevent direct access and therefore limit the benefits for large parts of our community. We are convinced that reducing these barriers and giving researchers intuitive and informative access to complex climate data will support interdisciplinary research and ultimately advance our understanding of climate dynamics.  

Aims of the project 

This project aims to create a web application that provides exciting interactive access to climate research data. An extensive database of global paleoclimate model simulations will be the backbone of the app and serves as a hub to integrate data from other environmental sciences. Furthermore, the intuitive browser-based and visually appealing open access to climate data can stimulate public interest, explain fundamental research results, and therefore increase the acceptance and transparency of the scientific process. 

Technical implementation 

We developed a completely new, open-source application to visualise climate model data in any modern web browser. It is built with the JavaScript library “Three.js” to allow the rendering of a 3D environment without the need to install any plug-ins. The real-time rendering gives instantaneous feedback to any user input and greatly promotes data exploration. Linear interpolation within a series of 109 recently published global climate model simulations provides a continuous timeline covering the entire Phanerozoic (last 540 million years). Model data is encoded in RGBA colour space for fast and efficient file handling in mobile and desktop browsers. The seed corn funding enabled the involvement of a professional software engineer from the University of Bristol Research IT. This did not only help with transferring our ideas into a website but also ensured a solid technical foundation of the app which is crucial for future development and maintainability. In particular, a development workflow using a Docker container has been implemented to simplify sharing and expanding the app within the community. 

Screenshots of the app for the present day and the ice-free greenhouse climate of the mid-Cretaceous (~103 Million years ago). Shown are annual mean model data for sea surface temperature, surface ocean currents, sea and land ice cover, precipitation, and surface elevation

Current features 

The app allows the visualisation of simulated scalar (e.g., temperature and precipitation) and vector fields (winds and ocean currents) for different atmosphere and ocean levels. The user can seamlessly switch between a traditional 2D map and a more realistic 3D globe view and zoom in and out to focus on regional features. The model geographies are used to vertically displace the surface and to visualise tectonic changes through geologic time. Winds and ocean currents are animated by the time-dependent advection of thousands of small particles based on the climate model velocities. This technique – inspired by the “earth” project by Cameron Beccario – greatly helps to communicate complex flow fields to non-experts. Individual layers representing the ocean, the land, the atmosphere, and the circulation can be placed on top of each other to either focus on single components or their interactions. The user can easily navigate on a geologic timescale to investigate climate variability due to changes in atmospheric CO2 and paleogeography throughout the last 540 million years. 

Next steps 

The first public release of the “climatearchive.org” app is scheduled for autumn 2021. This version will primarily showcase the technical feasibility and potential for public outreach of the app. We anticipate using this version to acquire further funding for developing new features focusing on the scientific application of the website. First, we plan to add paleoclimate reconstructions (e.g., temperature) for available sites across geologic time. The direct comparison with the simulated model dynamics will be highly valuable for assessing the individual environmental setting and ultimately interpreting paleoclimate records. Secondly, we will generalise the model data processing to allow the selection and comparison of different climate models and forcing scenarios. Thirdly, we aim to provide the ability to extract and download model data for a user-defined location and time. We see the future of the app as a user-friendly interface to browse and visualise the large archive of available climate data and finally download specific subsets of data necessary to enable quantitative interdisciplinary climate research for a larger community. 

Contact details and links 

Sebastian Steinig, School of Geographical Sciences 

sebastian.steinig@bristol.ac.uk 

The public release of the website (https://climatearchive.org/) and source code (https://github.com/sebsteinig) is scheduled for autumn 2021.