EPIC Lab: Generating a first-person (egocentric) vision dataset for practical chemistry – data analysis and educational opportunities

Blog written by Chris Adams, Teaching Fellow, School of Chemistry, University of Bristol

This project was funded by the annual Jean Golding Institute seed corn funding scheme.

Our project was a collaboration between the Schools of Computer Science and Chemistry. The computer scientist side stems from the Epic Kitchens project, which used head-mounted GoPro cameras to capture video footage from the user’s perspective of people performing kitchen tasks. They then used the resulting dataset to set challenges to the computer vision community: can a computer learn to recognise tasks that are being done slightly differently by different people? And if it can, can the computer learn to recognise whether the procedure is being done well? Conceptually this is not so far from what we as educators do in an undergraduate student laboratory; we watch the students doing their practicals, and then make judgements about their competency. Since chemistry is essentially just cooking, we joined forces to record some video footage of undergraduates doing chemistry experiments. Ultimately, one can imagine the end point being a computer trained to recognize if an experiment was being done well and providing live feedback to the student; like a surgeon doing an operation wearing a camera that can guide them. This is way in the future though….

There were some technical aspects that we were interested in exploring – for example, chemistry often involves colourless liquids in transparent vessels. The human eye generally copes with this situation without any problem, but it’s much more of a challenge for computers. There were also some educational aspects to think about – we use videos a lot in the guidance that we give students, but these are not first person, and are professionally filmed. How would footage of real students doing real experiments compare? It was also interesting to have recordings of what the students actually do (as opposed to what they’re told to do) so we can see at which points they deviate from the instructions.

We used the funding to purchase a couple of GoPros to augment those we already had, and to fund two students to help with the project. Over the course of a month, we collected film of about 30 different students undertaking the same first year chemistry experiment, each film being about 16 GB of data (thanks to the rdsf for looking after this for us). It was interesting to see how the mere fact of wearing the camera affected the student’s behaviour; several of them commented that they made mistakes which they wouldn’t normally have done, simply because they were being watched. As somebody who has sat music exams in the recent past I can testify that this is true….

One of the research students then sat down and watched the films, creating a list of which activities were being carried out at what times, and we’re now in the process of feeding that information to the computer and training it to recognize what’s going on. This analysis is still ongoing, so watch this space….

The Jean Golding Institute seed corn funding scheme

The JGI offer funding to a handful of small pilot projects every year in our seed corn funding scheme – our next round of funding will be launched in the Autumn of 2019. Find out more about the funding and the projects we have supported in our projects page.

Can machines understand emotion? Curiosity Challenge winners announced

Photo courtesy of Alex Smye-Rumsby

We are pleased to announce the winners of the Curiosity Challenge are Oliver Davis and his team here at the University of Bristol: Zoe Reed, Nina Di Cara, Chris Moreno-Stokoe, Helena Davies, Valerio Maggio, Alastair Tanner and Benjamin Woolf.

The team will be collaborating with We The Curious on a prototype, which is due to be ready in October and will be going live to audiences when the new exhibition at We The Curious opens next year. Oliver Davis is an Associate Professor and Turing Fellow at Bristol Medical School and the Medical Research Council Integrative Epidemiology Unit (MRC IEU), where he leads a research team in social and genetic data science. Together his team and We The Curious will develop a ‘Curiosity Toolkit’ for a public audience called ‘Can machines understand emotion?’ The team’s toolkit will invite audiences to:

  • Share the idea that humans can produce data that help to classify emotions
  • Recognise that humans produce lots of data every day that expresses how they feel, and that researchers can use these data to teach machines to interpret those feelings
  • Experience a live example of how the type of data they produce can contribute to an Artificial Intelligence (AI) solution to a problem
  • Understand why researchers need computers to help them to analyse huge volumes of data
  • Contribute to and influence current research being undertaken by the team
  • Appreciate how these data can be used on a large scale to understand population health.

Oliver Davis says “Our toolkit will guide participants through the process of teaching machines how to recognise human emotion, using a series of five activities. This is directly relevant to our current research using social media data in population cohorts to better understand both mental health difficulties and positive emotions such as happiness and gratitude.”

Helen Della Nave at We The Curious said “The enthusiastic response from researchers to work with our public audiences was fantastic. Working with Oliver’s team will give audiences the opportunity to influence development of a new database of emotions and support future research. We are very excited about our audiences having the opportunity to get actively involved in this project.”

Through this competition, We The Curious have also offered Rox Middleton, a Post-doctoral Research Fellow at the University of Bristol a research residency for her project ‘How to use light’.

For further details of the competition requirements and background, see Curiosity Challenge.

The Jean Golding Institute data competitions

We run a number of competitions throughout the year – to find out more take a look at Data competitions.

Visualising group energy

Blog written by Hen Wilkinson, School for Policy Studies at the University of Bristol.

The project was funded by the annual Jean Golding Institute seed corn funding scheme. It emerged from Hen’s ESRC funded PhD research, supported by the SWDTC and School for Policy Studies.

Collaborative working is central to tackling the world’s complex problems but is not easy to sustain

Power dynamics and inequalities play out in all directions, in the relationships between individuals just as much as between organisations. By making ‘hot spots’ visible in group interactions it becomes easier to acknowledge and work with points of conflict that will inevitably arise and to deal with them in a creative and sustainable manner.

While researching ‘the space between’ individuals and organisations, qualitative researcher Hen Wilkinson and data scientist Bobby Stuijfzand developed a new methodology using computer software to visualize energy shifts in group interactions. Listening to audio recordings of groups working together on a task, the impact of nonverbal elements in the group interaction was striking, with dynamics between participants influenced just as much by the nonverbal content of laughs, silences, sighs, asides and interruptions, as by the words spoken.

Visualizing shifts of energy – a new approach in qualitative research

Following this observation, the ambition to visualize these tangible shifts of ‘energy’ in the groups took hold. To date, little attention has been paid to generating computer visuals in qualitative research, so creating a rigorous, systematic visualization of energy shifts was lengthy, challenging and exciting. For more detail on the rationale and methodology we developed over the course of two years and to view the final interactive versions of the design, see Visualizing energy shifts in group interactions. Among the many challenges we faced were finding and adapting an instrument to use with small and interactive qualitative datasets; establishing interrater reliability; identifying what was meant by ‘energy’; deciding which nonverbal elements to visualize; and how to present the resulting data.

On the website we present four 5-minute visualized extracts of group interaction, each drawn from a different group discussion, two of which were held in the UK and two in the Netherlands. Each extract of data is five minutes long, made up of 2.5 minutes of interaction either side of a central mid-point clash or strong challenge in the group. The five minutes of data were then scored by a team of raters listening independently to audio clips of the extract divided into meaning units, which are shown as ‘topic shifts’ on the visualizations. In this way, the qualitative data was converted into numerical values for three main variables – levels of mood and engagement as they shifted over a set period of time.

The support of seed corn funding from the Jean Golding Institute allowed us to work on the presentation of the visualizations, from realising an interactive website which showed how the numerical data we used was reached to refining the aesthetics of the design to encourage maximum engagement with the graphs and clarity of understanding in the viewer. Initial images were generated using ggplot2, a data visualization package for the statistical programming language ‘R’ – see Initial visualizations.

Initial visualizations

Following the generation of these first images, we explored the significance of data presentation through extensive design research, working with designer Derek Edwards. This drew on multiple sources in a visual exploration of accessibility, of the impact of colour, of multi-layered research and into the use of pattern, texture, animation and shape in displaying qualitative data. Slides from the design research show some of the various considerations we were reflecting on:

Design considerations

The initial images generated with ‘R’ were then refined using D3.js, a powerful and well-regarded software library used extensively to create interactive data visualizations on the web. Refining the aesthetics of the design was important to the project, both in terms of encouraging maximum engagement with the graphs and in terms of data clarity. Each graph contains multiple layers of information, from group participant engagement levels to the overall mood of the group, points of topic shift in the group discussions and dropdown text boxes of the verbal interactions between participants at any topic shift point.

The example below – visualizing a strikingly bad-tempered interaction – uses the final design we settled on (see Visualizing energy shifts in group interactions) once all considerations had been taken into account. The ‘energy line’ running through the centre of the graph is a composite of engagement and mood results and is cut across by a second nonverbal indicator of group dynamic – incidents of laughter illustrating both use and function. As outlined in the methodology sketch, we developed a categorisation for types of laughter heard in this study ranging from cohesive (green) through self-focused (yellow) to divisive (red). In this group, laughter can be seen to anticipating the shifts in mood from positive (green) to negative (red) and back again.

This project has sparked considerable interest, both in terms of its early-day implications for qualitative and mixed methods research and in terms of its potential as an applied tool for teams, organisations and collaborations to use. Further funding in 2019 through an Impact Award has enabled the interdisciplinary team working on the project to embark on further developments and connections.

We are fully aware of the work-in-progress nature of this approach and are very interested to receive feedback, comments, ideas for future applications from anyone out there! If you would like more information on this visualization project or have a comment to share, please contact the lead researcher, Hen Wilkinson, via hen.wilkinson@bristol.ac.uk.

The Jean Golding Institute seed corn funding scheme

The JGI offer funding to a handful of small pilot projects every year in our seed corn funding scheme – our next round of funding will be launched in the Autumn of 2019. Find out more about the funding and the projects we have supported.


Reusing qualitative datasets to understand shifts in HIV prevention 1997-2013

Photo (copyright D. Kingstone): This image of Catherine and Ibi in conversation represents varied layers of clarity/blurriness that were a constituent part of the anonymising process. Decisions about the removal of potentially identifying data got talked through by both researchers until they achieved clarity about the best way forward.

A conversation between Dr Catherine Dodds and Dr Ibidun Fakoya

The project was funded by the annual Jean Golding Institute seed corn funding scheme.

Qualitative data re-use and open archiving

This project aimed to demonstrate the considerable value of qualitative data re-use and open archiving. Our team undertook in-depth anonymisation of two existing qualitative HIV datasets by applying and refining an anonymisation protocol. The two qualitative datasets anonymised were:

  • Relative Safety: contexts of risk for gay men with HIV (2008/09) 42 transcripts, Sigma Research
  • Plus One: HIV serodiscordant relationships among Black African people in England (2010/11) 60 transcripts, Sigma Research

The key aim of the project was to ready these materials through the removal of personally identifying information, so that the deidentified data can then be deposited with the UK Data Archive. We provided meta-data (including participant recruitment materials, data collection templates, related research outputs, thematic lists used in coding and details of the anonymisation) for each submission.

In this blog post, Dr Catherine Dodds and Dr Ibidun Fakoya from the School of Public Policy, converse about the ethical and practical considerations of archiving qualitative data. Catherine was involved in the original data collection and was the PI for this project, and Ibidun undertook the bulk of the anonymising work.

Ibidun: What motivated you to deposit these datasets to the UK Archive?

Catherine: A few years back I was awarded funding from the Wellcome Trust to examine the feasibility of re-using and archiving multiple qualitative datasets relating to HIV in the UK. Working with a coalition of other UK researchers on that project, we learned that while the UK Data Archive makes the process of deposit incredibly straightforward, what takes much more time is the decision-making, data transfer and preparation of data for deposit. We were looking at depositing projects that go quite far back in time, before the notion of Open Data was a widespread concept, so there was a lot to be considered in terms of readying these transcripts for deposit in a way that is useful, ethical and responsible. A key outcome of that work was the development of an anonymisation protocol to assist with the practical and ethical decision-making that is involved when readying such data for sharing in an archive.

Ibidun: How did you decide which datasets to deposit?

Catherine: During my 16-year career with Sigma Research (latterly at LSHTM), I was involved with and led on a considerable array of qualitative studies. I selected the data from Plus One and Relative Safety II because they were both undertaken just over ten years ago, at a time when it became more clear that HIV pharmaceuticals were being positioned as HIV prevention technologies. Because this is an area of particular interest for me, I wanted to personally revisit these two studies first in order to re-use them, while also anonymising them in readiness for archiving.

Ibidun: Do you think the ethical considerations for depositing data are different for qualitative and quantitative data? If so, how?

Catherine: They are absolutely different, because qualitative data tend to focus on the experiences, perspectives and human stories of participants in ways that are rich and detailed. This is one of the real strengths of this type of data. This means we need to anonymise in a way that goes beyond just identifying and removing personal names and names of organisations or places. Instead, we need to consider whether the overall narrative a person offers (as a collection of life experiences) could itself identify an individual who should be allowed to remain anonymous. This requires a highly skilled approach to anonymisation. If we were anonymising quantitative datasets, the risk of potential identification would probably be much lower, and anonymisation might just involve removing a few fields from a database.

Catherine : You weren’t involved in the original data collection, what contextual detail helped you to get started when anonymising these materials in readiness for archiving?

Ibidun: It helped that I am familiar with the HIV research in the UK. I started out working in HIV and sexual health back in 2001, so I was aware of the findings of these studies before I started the anonymisation. Nevertheless, it was useful to read through the original study materials such as the research protocols, topic guides, interview schedules and fieldnotes. Speaking to the original investigators also provided insights to the research landscape at that time. By understanding the original aims, objectives and findings from the studies, I was able to focus on just the anonymisation rather than become distracted by the themes that were emerging from the data.

Catherine: How did you tackle the task of reading through so much text and remaining alert to the requirements of anonymisation?

Ibidun: Anonymisation takes a lot of concentration. You need to remain focussed on the transcripts and read every word to ensure that you do not miss any identifiers. I knew that I would struggle to remain alert if I tried to read the transcripts on my computer because I am used to skim reading articles on screen. Initially, I had thought about printing out all the transcripts, but I am conscious of wasting paper. Instead, I made use of the “Learning Tools” in Microsoft Word. I followed these steps to improve my focus and comprehension and ensure I read every word:

  1. Go to View > Learning Tools
  2. Select Column Width to compress sentence line length to make the page narrower
  3. Select Read Aloud, to hear the document as each word is highlighted.
  4. Increase the Read Aloud speed so you are reading approximately 300 words per minute.

It takes a little while to get used to the Read Aloud function, particularly at speed, but ultimately, I found this method to be the most efficient way to remain focused and quickly read through the large volume of text.

Catherine: How did you find the anonymisation protocol that was devised as a support tool?

Ibidun: The protocol was useful for getting started with the task, particularly for straightforward guidance on how to deal with direct identifiers and geographic locations. For more complicated anonymisation (e.g. “Situations, activities and contexts”) the guiding principles set out in the protocol provided only a starting point, meaning we needed to identify cases for team discussion where the potential for identification was high.

Catherine: What advice about anonymising qualitative datasets would you give others who want to archive similar materials for re-use?

Ibidun: My top three tips are:

  1. Keep a research diary like you would do for any other study. Keep note of your reflections and ideas as these may come in handy later.
  2. Work in a team of at least two so you can discuss any ambiguous decisions about de-identification.
  3. Your first duty is to protect the anonymity of the interviewee. If you cannot do that without destroying the integrity of the data (because you have to redact too much material) then err on the side of caution and keep the transcript out of the archive. When in doubt, do not deposit.

Catherine: Is there anything that surprised you in undertaking this work?

Ibidun: I was surprised by the emotional impact of reading the transcripts. Many of the interviewees recounted traumatic events or spoke about painful personal relationships. At times I found myself angry about injustices interviewees had faced, especially those who had been subject to criminal investigations for the reckless transmission for HIV. Therefore, anonymising such sensitive information has the same ethical considerations for researchers as undertaking original qualitative data collection. Researchers undertaking anonymisation also need to pause and reflect on the effects of engaging with emotionally charged narratives and be able to discuss these with colleagues.

Catherine: What value is there to making these materials available to other researchers through the UK Data Archive?

Ibidun: I hope researchers from outside the field of sexual health and HIV research can use these narratives in new and novel ways. It is possible that themes unrelated to the original research might emerge from the data for other researchers. For example, a linguist might want to examine changes in speech patterns among gay men in the UK. A sociologist might examine the datasets about the impact of unemployment on black African migrants in England. There’s a lot of potential in re-using these datasets, perhaps in combination with other data from the UK Data Archive.

Ibidun: I can throw that question back at you, how useful are qualitative datasets for other researchers?

Catherine: I suspect that will be up to them to decide. We have had interest from PhD students and other colleagues who want to use these data to interrogate specific historical aspects of HIV in the UK. It is a shame that we have not been able to undertake anonymisation and deposit more swiftly, but our learning is that to do this work retrospectively takes a great deal of re-familiarisation and case-by-case decision making. Archivists at the UKDA have been very excited about the prospect of having a themed set of qualitative data on social aspects of HIV in their collection and are convinced that this will be of use for researchers focussed on HIV. Social historians, LGBT and queer studies specialists, anthropologists and others might also have use for the data.

Ibidun: What are the methodological considerations when re-using qualitative data?

Catherine: I have just written a methods article on this subject, but in brief:

  1. It is essential that the person re-using the data becomes as familiar as possible with the original context and goals of the project from which the data emerges. Hopefully there will be metadata available to support them in this, and they also should seek to discuss the project with those originally involved (where possible). In my own case, even though I was one of the original data collectors, I was amazed by just how much I had already forgotten (or re-structured in my own mind’s eye).
  2. It is instructive to attend to Hammersley’s (2010) reflections on re-use, which encourage us to think about the given and constructed nature of the data we encounter in these endeavours. For instance, my colleague Peter Keogh and I have approached re-use purposively; we were interested in the theme of biomedicalization and so were selective about which particular projects and transcripts we chose to analyse. We wanted to capture both the mundane and the challenging aspects of life in close proximity to HIV. At the same time, some of the given elements of these data emerged from the shadows in ways that had taken us off guard and reminded us of what it was to work in different moments and places of an unfolding epidemic. And furthermore, as Irwin et al. (2012) have also argued, bringing data and researchers together across datasets can afford an opportunity for listening out to silences which enable us to open up new interpretive avenues.

The Jean Golding Institute seed corn funding scheme

The JGI offer funding to a handful of small pilot projects every year in our seed corn funding scheme – our next round of funding will be launched in the Autumn of 2019. Find out more about the funding and the projects we have supported.

Metastable impressions

Blog written by Rob Arbon, Alex Jones, George Holloway and Pete Bennett

This project was funded by the annual Jean Golding Institute seed corn funding scheme.

The JGI funded project “Metastable impressions” sought to bring together statistical modelling, sound engineering, classical composition and deep learning to create an audio-visual art work about the dynamics of proteins and their representations. The project grew out of work by PhD candidates Alex Jones and Rob Arbon (supervised by Dr Dave Glowacki) called ‘Sonifying Stochastic Walks on Biomolecular Energy Landscapes’. See also blog

The project team was comprised of Dr Pete Bennett (project supervisor), Alex Jones (sonification), Rob Arbon (animations and statistical modelling) and Dr George Holloway, Department of Ethnomusicology, Nanhua University, Taiwan (composition).  We shall first give a more detailed overview of the project and then hear from Rob, George and Pete about their specific contributions and thoughts on the project.

All of the publicly available materials are available on our repository at the Open Science Framework.

Project overview

The core of this project is the Sonification: the process or turning information into sound. Take for example the popularity of the search term ‘Proteins’ on Google:

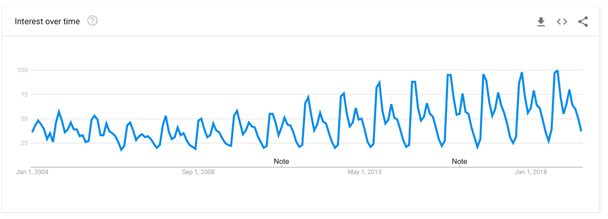
Here we map the popularity of the search term to the position of a blue dot in the vertical direction and the time that this relates to the position in the horizontal direction. In this way we make a visual display of the popularity over time. However, we could map the popularity to, say, the pitch of a piano sound and play them in the same order as the order they were observed in. This would result in an audio display (the other name for sonification) of the information, in this case the sound of a piano piece rising and falling in pitch over time.

The information that we wanted to sonify was a statistical model of protein, SETD8. The data for this protein came from the lab of John Chodera and was produced by Rafal Wiewiora. You can read about the amazing effort to produce this dataset in Computational ‘Hive Mind’ helps scientists solve an enzyme’s cryptic movements.

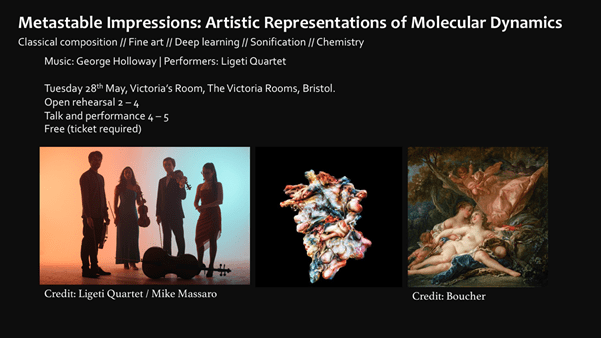
One criticism of sonification is that it is very hard to listen to for long periods of time so we decided to recruit a classically trained composer to help us design a sonification that would be pleasing to listen to. In order to help do this, the composer George Holloway composed the piece Metastable for string quartet which was performed by the Ligeti String Quartet in a performance event in May. The whole event  (unfortunately including the ‘click track’ for the quartet only) was streamed on Twitter.

In addition to the sonification and string quartet we wanted to produce novel visual representations of the protein. To do this we used a technique called style transfer to impart style from paintings to more traditional representations of the protein. One example can be found on the flyer for the performance:

The right-hand image is of a painting by the French artist Boucher and in the middle is a representation of the protein ‘in the style of’ Boucher.

The string quartet and visual representations of SETD8 were linked through a timeline of scientific thought loosely related to proteins, chemistry and statistical modelling. We highlighted five different scientists, corresponding to the five movements of Metastable, with contemporaneous (both geographically and temporally) artworks and composers. The five composers provided the musical style of each movement, while the five artworks provided the artistic style of the protein representations. Our final timeline was:

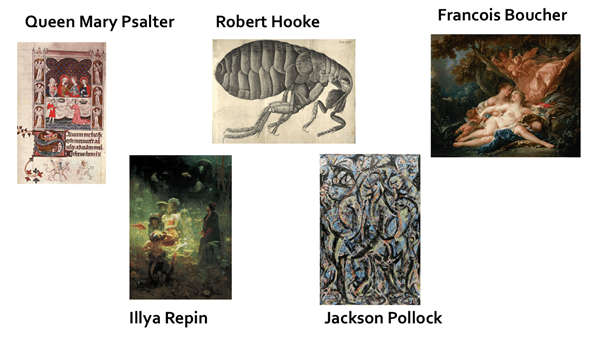
I. Medieval period, England

The scientist we chose was Roger Bacon for his work on developing the ‘scientific method’. The composer was Godric of Finchale and the art work was an illumination from the Queen Mary Psalter by an unknown illuminator.

II. 17th Century, England

The scientist we chose was Robert Hooke for his investigation of the microscopic world which was beautifully illustrated in his book Micrographia. The artwork we chose was an image of a flea from this work and the composer was Henry Purcell.

III. 18th Century, France

Our understanding of protein dynamics is, in part, statistical, so for that reason we chose a pioneer of statistics Pierre Simon Laplace as our scientist. The visual source material was Jupiter in the Guise of Diana and the Nymph Callistor by François Boucher and the composer was the prolific opera composer Jean-Philippe Rameau.

IV. 19th Century, Russia

Protein motion has the property of being ‘memoryless’ which means that its future motion isn’t determined by its past motion. Andrey Markov was a mathematician who studied this type of process. Russian contemporaries of Markov were the composer Modest Mussorgsky and artist Illya Repin, whose work Sadko gave us the fourth visual style.

V. 20th century, USA

Many of the advances in our understanding of Proteins came from the UK, such as Kendrew and Perutz (first protein structure determination by X-ray crystallography), and Dorothy Hodgkin (structure of vitamin B12 and insulin).  However, we wanted to avoid more UK based scientists so we instead went for Berni Alder & Thomas Everett Wainwright for their work on simulating molecules and Frances Arnold whose Nobel prize winning work has given us novel ways for creating enzymes (a type of protein).  The composer we chose was Morton Feldman whose work incorporated uncertainty and thus seemed natural to complement the statistical nature of protein motion. The artwork we chose is Gothic by Jackson Pollock, another prominent artist on the New York art scene along with Feldman.

The art works for each movement can be seen below:

Rob Arbon, animations and statistical modelling

My role in this project was twofold:  

  1. to create the statistical model of the protein dynamics from the data provided by the Chodera lab
  2. produce animations of the protein in the style of the artists from the time line. 

The statistical tool I used was a Hidden Markov Model (HMM) which takes multiple time-series of the protein and classifies them as belonging to a small number of distinct states (in our case five) called Metastable States. Protein motion can then be thought of as hopping from metastable state to metastable state. We took five representative time-series and used how the protein hopped from state to state as a structure for each movement of the string quartet.  

In our previous work, Alex Jones and I had already worked out how and what information contained in the HMM to sonify and so we were able to use that framework to sonify this system.  

To create the animations I used a technique called style transfer. This uses deep convolutional neural networks (CNN) which are used to classify images. We can ask ourselves (mathematically, of course) what a CNN considers the ‘style’ of an image.  Below, I asked Google’s Inception CNN what it thought the style of the Boucher image was. 

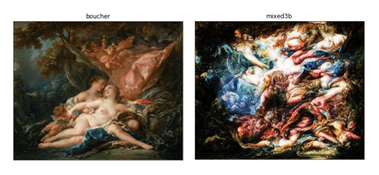
On the left-hand side is the original image and on the right-hand side is the CNNs conception of ‘style’ at a particular point in the classification process. There are other points available which pick up different types of style not shown hereThe style transfer algorithm takes this conception of style and blends it with arbitrary ‘content’ images. In this case our content images are the traditional representations of proteins. The image below shows this

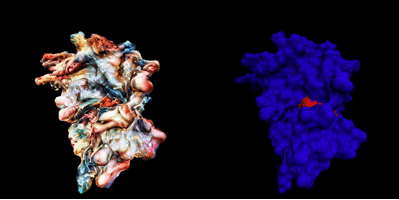
The right-hand image here is a content image – a traditional representation of a protein which shows the surface atoms of the protein only. The left-hand image is a blending of the pure Boucher style above and the content image. I did this for 10’000 still images of the protein and used these stills to create the animations accompanying the string quartet.  

There were a number of challenges I faced in performing my part. The first was to find appropriate parameters of the statistical model which gave musical structures which were usable by George. The second was to find appropriate parameters of the style transfer process, most notably how to pre-process the images and what particular conception of style for each artwork to transfer over to the content image.  

Alex Jones, sonification

My role was to create a faithful sonification of the protein dynamics using electronic musical synthesisThe primary aim of the sonification is to allow the listener to hear accurately the information being aurally displayed. This is in contrast to the string quartet which was primarily a piece of music ‘informed’ by the data.  

In our previous work, Rob Arbon and I worked out which parameters of the HMM were most useful to represent and my expertise in sound engineering allowed us to map these to synthesized sounds which synchronised with traditional animations of the protein. In this way the user can see structural information while simultaneously hearing more abstract concepts of the protein such as its stability.  

In this project the sound design was informed by my conversations which George on more traditional musical theory topics such as the harmonic series and chord inversions. The end result was a sonification of the data underlying the first movement of Metastable and is available at the project OSF repository.  

There were a number of challenges in this project which needed to be overcome. The first being that the new harmonic language introduced by George was complex and mapping information to sounds became much more challenging than our previous sonification. The second major challenge was overcoming the language barrier between the classical and sound engineering worlds. We were both surprised however at how much common ground we shared once our respective nomenclatures and conventions had been explained. 

George Holloway, composer, Department of Ethnomusicology, Nanhua University, Taiwan

I had a dual role in the project. The first was to work with Alex Jones on the sonification, to find readily audible musical structures that could meaningfully convey to an audience the aspects of the data we deemed to be relevant. In so doing, we had to consider not just the audibility, but also the listenability of the musical structures we chose. This naturally touches upon one’s individual judgement and taste, and so takes the sonification a step beyond the merely slavish translation of data into sound, into an aestheticised or crafted sonification. My second, and quite distinct role, was to compose a piece of music that was both data-sonification and an autonomous artwork— a sort of data-inspired music.  

For both sonification and composition, the “legibility”, or more aptly, the audibility of the relationship between underlying data and heard result was crucial, but for subtly different reasons. The musical composition, while not in any way intended as a data-scanning tool like the sonification, and only weakly intended as a public science-communication tool, nonetheless is ineradicably bound to the underlying data. For the music to have a clear expressive purpose, one must be able to appreciate that there are processes of tension and change in the music evocative of the physical processes at work in the molecular dynamics. In the “Metastable Impressions” project this stricture was made even more acute by the combination of the music with a projected visualisation of the molecule. The music could not therefore be completely autonomous (freely treating the material in its own time and following its own development), but had necessarily to conform to the same time structure and transformations of material to which the visualisation conformed, as dictated by the underlying data.   

There had to be some accommodation to aesthetic considerations at the stage of choosing the portions of data to be sonified (the “trajectories”): I proposed parameters to which the data should conform in order for it to be usable for generating musical material. Once Robert Arbon had selected trajectories according to these parameters, however, it was clear that the data would entirely preclude a “traditional” musical syntax and phraseology.  

This influence of the data proved to be decidedly advantageous for me as the composer, and was perhaps the most valuable insight I gained from composing the piece: precisely because the time structures and repetitions of material dictated by the data precluded more expected “organic” development of the materials, the five movements that made up my piece Metastable naturally took on unexpected and spontaneous-feeling structures. The music felt elusive and yet not incoherent, at least to my mind.  

One final aspect to mention is the use of style-transfer in both the visualisation (using machine-learning) and in the musical composition (done “manually” by me as the composer). In a sense, my stylistic use of earlier composers, such as Purcell and Mussorgsky, sits in a time-honoured tradition of musical borrowing known as “transcription”. The idea was that both visualisation and music would take on stylistic aspects of the time periods and locations related to important developments in the history of science that led to the present research into molecular dynamics. This in itself added an entirely other layer of aesthetic considerations to a complex but very rewarding project. 

Dr Pete Bennett, project supervisor

I took a supervisory role in the Metastable Impressions project, attending the weekly meetings and overseeing the technical and artistic collaboration between Rob, George and Alex. Having a background in both computer science and music has been useful throughout the project as it has allowed me to fully appreciate the outstanding work done by the team and occasionally allowed me to act as a bridge when miscommunications arose during the meetings. I’ve particularly enjoyed the approach to interdisciplinary working that this project has taken, with the three disciplines of music composition, computational chemistry and sonification all playing an equal role in leading the project forward. At no point was there the feeling of one being held to have greater importance and dominating the discussion. Additionally it was great to see time and effort being taken throughout the project for complex terminology and theory to be explained in a simple manner to all team members. 

The result of this project is hard to describe – a string quartet, playing a score based on molecular dynamic structure, musically influenced by both sonification techniques and the history of composition, accompanied by a visualisation that uses machine learning to transfer artistic styles from the history of chemistry. The difficulty of describing what was achieved arises from the fact that no single element takes precedent and overall is testament to the truly interdisciplinary nature of the project. Despite the difficulty of explaining the project on paper, the concluding performance brought together all of the strands together seamlessly into one clear artistic vision that was very well received by the audience, resulting in a deep debate that spanned all the disciplines involved. 

The Jean Golding Institute seed corn funding scheme

The JGI offer funding to a handful of small pilot projects every year in our seed corn funding scheme – our next round of funding will be launched in the Autumn of 2019. Find out more about the funding and the projects we have supported.