Ask JGI Student Experience Profiles: Marina Vabistsevits

ASK-JGI Student: Marina Vabistsevits
Marina Vabistsevits, Final year PhD student in Population Health Sciences at Bristol Medical School

JGI Student Experience Profiles: Marina Vabistsevits (Ask-JGI Data Science Support 2022-23)

What made you decide to apply to join the Ask-JGI team?

I applied to join the Ask-JGI team because I wanted to be involved in a wider data science community at the University of Bristol. I wanted to learn about data-intensive research in other disciplines and possibly gain data science skills outside my PhD project.

What did you find most rewarding about your Ask-JGI experience?

Being a part of the Ask-JGI team meant helping other researchers at the University with their data science queries. The queries we received involved anything from statistics, programming, data visualisation, machine learning, NLP, but also data ethics, data storage, software development, and even public engagement. I enjoyed being exposed to many aspects of data science, which would otherwise be impossible during one PhD programme. The most rewarding part of this experience was researching how to best help the person with their query to find the solution that would work for them, thereby helping them to advance their research at the University.

What sort of work did you do as a part of your Ask-JGI experience?

My favourite queries involved helping people with R programming, often including statistics, data visualisation, and app development. I was also involved in a long-term project with the Professional Services team at the University with another Ask-JGI student. We helped the team with analysing and producing insights from an extensive survey. This allowed the team to make data-informed decisions about the next steps, which may have a University-wide impact.

Another exciting part of my Ask-JGI experience was going to the AI UK 2023 conference in London to present and promote the Data Hazards framework developed by former colleagues at the JGI.

Would you recommend this experience to other students?

I would absolutely recommend joining the Ask-JGI Data Science support team. It is an excellent opportunity to learn about data science outside your immediate field, gain practical knowledge in new areas, and experience a data science consulting role! You also get to meet really interesting people and learn about the broader application of the skills you’re gaining in your current PhD programme.

Partial Discharge Analysis in Wide Bandgap-Based Motor Drive Systems – Dr Wenzhi Zhou and Prof. Xibo Yuan

JGI Seed Corn Funding Project Blog 2022-2023: Dr Wenzhi Zhou and Prof. Xibo Yuan

The power electronics industry is currently experiencing significant changes due to the emergence of ultra-fast transistors made from wide bandgap (WBG) materials, which are replacing silicon transistors. These new transistors have a switching speed that is 10 times faster, resulting in a 70% reduction in energy loss in converters and enabling motor drive systems to be reduced to less than half their previous size. However, the short voltage rise times (<20ns) and high frequencies (up to MHz) of WBG converters pose new challenges for the insulation of motor drive systems, leading to a drastic decrease in their lifespan.

PD is a well-established diagnostic indicator for assessing the deterioration of electric motor insulation in power converter-fed motor drive systems. It allows for the estimation of service requirements or the prediction of imminent failures. However, the adoption of WBG converters introduces new complexities that can impact the accuracy of PD measurements. Factors such as short voltage rise times (less than 20 ns, comparable to the time it takes light to travel 6 meters) and high frequencies (reaching up to MHz) associated with WBG converters pose significant challenges for insulation within motor drive systems, ultimately leading to a reduction in their lifespan.

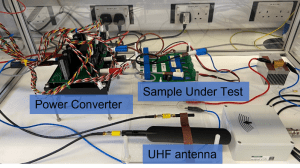
To address these challenges and improve PD detection accuracy, we have undertaken research supported by funding from the Jean Golding Institute (JGI). As part of this endeavour, we have developed a specialized PD detection setup, as illustrated in Figure 1. Figure 1a depicts the schematic representation, while Figure 1b showcases the experimental setup we have established. Through this setup, we have conducted preliminary experiments to examine PD behaviour under different excitations, including two-level and three-level pulse width modulation (PWM) waveforms. An example of the PD signal observed under two-level PWM excitations is shown in Figure 2.

Experimental PD setup: (a) schematic

(A)

Experimental PD setup: (b) hardware

(B)

Fig. 1 Experimental PD setup: (a) schematic and (b) hardware.  


Fig. 2. The PD signal under the two-level PWM excitation.

The JGI funding has also facilitated collaboration with esteemed experts in the field, including Dr. Jin Zheng from the Engineering Mathematics Department and Dr. Wenbo Wang from Dynex Semiconductor. Their expertise and insights will play a crucial role in advancing our research efforts. Furthermore, we plan to leverage state-of-the-art artificial intelligence techniques to analyse the data we have collected. These techniques will enable us to extract meaningful insights and further enhance our understanding of PD in WBG-based motor drive systems.

Making sea ice thickness maps in the Canadian Arctic operationally available

JGI Seed Corn Funding Project Blog 2022-2023: Isolde Glissenaar

Image of western and eastern artic mapSea ice thickness is a key variable when characterising an ice cover and its impact on the local environment and provides important insight into how an ice cover is changing in response to climate change. Unfortunately, observations of ice thickness are sparse, especially in the channels in the Canadian Arctic Archipelago. Sea ice thickness is also an important factor in assessing the safety of shipping in Arctic regions. The Canadian Arctic Archipelago is bisected by the Northwest Passage and is home to many northern communities that rely on marine traffic for resupply. Understanding the changes in ice thickness within the Canadian Arctic Archipelago and monitoring it in the future is therefore of vital importance.

The JGI funded my seed corn project to make sea ice thickness maps in the Canadian Arctic operationally available on a website. The ice thickness maps are created with a machine learning model that uses ice charts (maps of sea ice) from the Canadian Ice Service to estimate sea ice thickness. The ice charts have information about the sea ice concentration, the age of the ice, and the size of the separate ice floes. These characteristics all relate to sea ice thickness and can thus be used to create a proxy for sea ice thickness.

After comparing multiple machine learning methods, a Random Forest Regression model was found to give the best results. For my PhD, I applied this method on the archive of ice charts to determine sea ice thickness for the historic period 1996-2020. However, ice charts continue to be released every week, and this gave the possibility to run the model straight after a new ice chart is released and publish the resulting sea ice thickness map.

In this project I have automized the workflow so that a new sea ice thickness map is created as soon as an ice chart is released. This operational sea ice thickness map is subsequently made available online within 12 hours after the release of the ice chart. A beta-version of the website with both the operational ice thickness maps and the archive of sea ice thickness is now available on https://canadian-sit.streamlit.app/ for shipping navigators, local communities, and climate researchers to use.

Currently, the sea ice thickness maps can only be created for the winter months November-April. Future work would include extending the methods to the summer months when there is more shipping activity. The work can also be extended to the seas around Greenland, as the Danish Meteorological Institute creates similar ice charts for these regions.

For this project I collaborated with the Canadian Ice Service who create the ice charts and are responsible for communicating ice conditions with stakeholders in the region. If the method proves effective and the website reliable, the Ice Service could consider including the sea ice thickness maps in their advice to stakeholders.