
Blog written by Dr Stephen Chuter, Research Associate in Sea Level Research, School of Geographical Sciences, University of Bristol
This project was funded by the annual Jean Golding Institute seed corn funding scheme.
Antarctica and sea level – a grand socioeconomic challenge
Global sea level rise is one of the most pressing societal and economic challenges we face today. A rise of over 2 m by 2100 cannot be discounted (Ice sheet contributions to future sea-level rise from structured expert judgement), potentially displacing 187 million people from low-lying coastal communities. As a major and increasing contributor to global sea level rise, it is of critical importance to understand and quantify trends in the mass of the Antarctic Ice Sheet. Additionally, effective communication of this information is vital for policy makers, researchers and the wider public.
Combining diverse observations requires new statistical approaches
The Antarctic Ice Sheet is larger in area than the contiguous United States, meaning the only way to get a complete picture of its change through time is by using satellite and/or airborne remote sensing to supplement relatively sparse field observations. Combining these datasets is a key computational and statistical challenge due to the large data volumes and the vastly different spatial and temporal resolutions of different techniques. This challenge, which continues to grow as the length of the observation record increases and as new remote sensing technologies provide ever higher resolution data, requires new and novel statistical approaches.
We previously developed a Bayesian hierarchical modelling approach as part of the NERC-funded RATES project, which combined diverse observations in a statistically-rigorous manner. It allowed us to calculate the total mass trend at an individual drainage basin scale, in addition to the relative contribution of the individual component processes driving this change; such as variations in ice flow or snowfall. Being able to study the spatial and temporal pattern of the component process allows researchers to better understand what the key external drivers of ice sheet change are, which becomes critical when making predictions regarding about its future evolution.
Project goals
Our current work is aiming to achieve two major goals:
- Develop the Bayesian hierarchical framework and incorporate the latest observations in order to extend the mass trend time series until as close as possible to the present day.
- Synthesise the results in an easily accessible web application, so that users can interrogate and visualise the results at a variety of spatial scales.
The first of these goals is critical to providing model and dataset improvements, paving the way for the framework to be used over longer time series in order to better understand multi-decadal processes. The second goal, funded by the JGI seed corn award, is to provide these outputs in a manner that is easily used and understood by a range of stakeholders:
- Scientists – Ability to use the latest available results within their own research and as part of large international collaborative inter-comparisons (e.g. World Climate Research Programme).
- Policy makers – Allows easy interrogation of the results and have an accessible overview of the methodology. This will allow for project outputs to be easier included as evidence in policy making decisions.
- General public – Generate public interest in the research output, the method used and raise awareness of the potential impacts of climate change on ice sheet dynamics.
Results
To date we have extended mass trends for the Antarctic Ice Sheet up to and including 2015. This has enabled us to see the onset of dynamic thinning (changes in mass due to increased ice flow into the ocean) over areas previously considered stable such as the Bellingshausen Sea Sector and glaciers flowing into the Getz Ice Shelf.

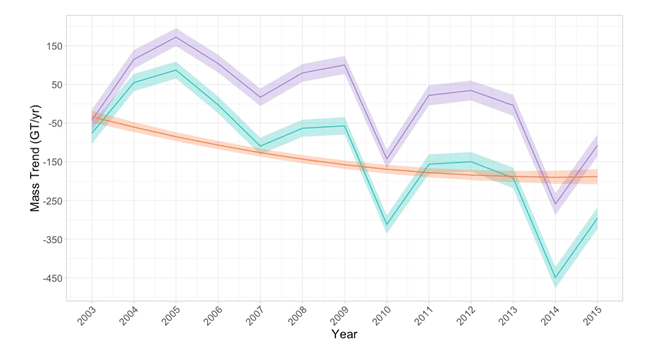
The cyan line represents total ice sheet mass change, the orange line represents changes due to ice dynamics (variations in ice flow) and the purple line represents changes in mass due to surface processes (variations in mass due to changes in precipitation and surface melt). The shaded areas around each line represent the one standard deviation uncertainty.
In order to disseminate these results, a new web application has been developed. This allows users to interactively explore and download the updated results. Additionally, the web application features a second interactive page, aimed at the public and policy makers, which provides an overview of the datasets used in this work.
Future plans
The project has allowed us to make key advances in this methodology, laying the foundations for extending the time series nearer to the present day. Future plans include incorporating additional observations from the new ICESat-2 and GRACE follow-on satellite missions. Ultimately, the extended time series will be an important input dataset for the GlobalMass ERC project, which aims to take the same statistical approach to study the global sea level budget.
The creation of the web application will allow for future updates to be quickly communicated, which allows our results to be incorporated in related research or policy making decisions. We hope to extend the web application functionality further to include more outputs from the GlobalMass project.
The Jean Golding Institute seed corn funding scheme
The JGI offer funding to a handful of small pilot projects every year in our seed corn funding scheme – our next round of funding will be launched in the Autumn of 2019. Find out more about the funding and the projects we have supported.