Multitask learning for AMR

Blog written by Rob Arbon, Data Scientist at the University of Bristol.

This project was funded by the annual Jean Golding Institute seed corn funding scheme.

Multitask learning for AMR

“Multitask learning for AMR” developed out of our collaboration with the Jean Golding Institute on the One Health Selection and Transmission of Antimicrobial Resistance (OH-STAR) project funded by the Natural Environment Research Council (NERC), the Biotechnology and Biological Sciences Research Council (BBSRC) and the Medical Research Council (MRC).

OH-STAR is seeking to understand how human activity and interactions between the environment, animals and people lead to the selection and transmission of Antimicrobial Resistance (AMR) within and between these three sectors. As part of this project we collected thousands of observations, from over 50 dairy farms, of the prevalence of AMR bacteria, as well over 300 potential environmental variables and farm management practices which could lead to AMR transmission or selection (so called risk factors). If we can identify these risk factors the hope is that we can use this information to shape policy to reduce the spread of AMR into the human population where it threatens to cause widespread death and disease.

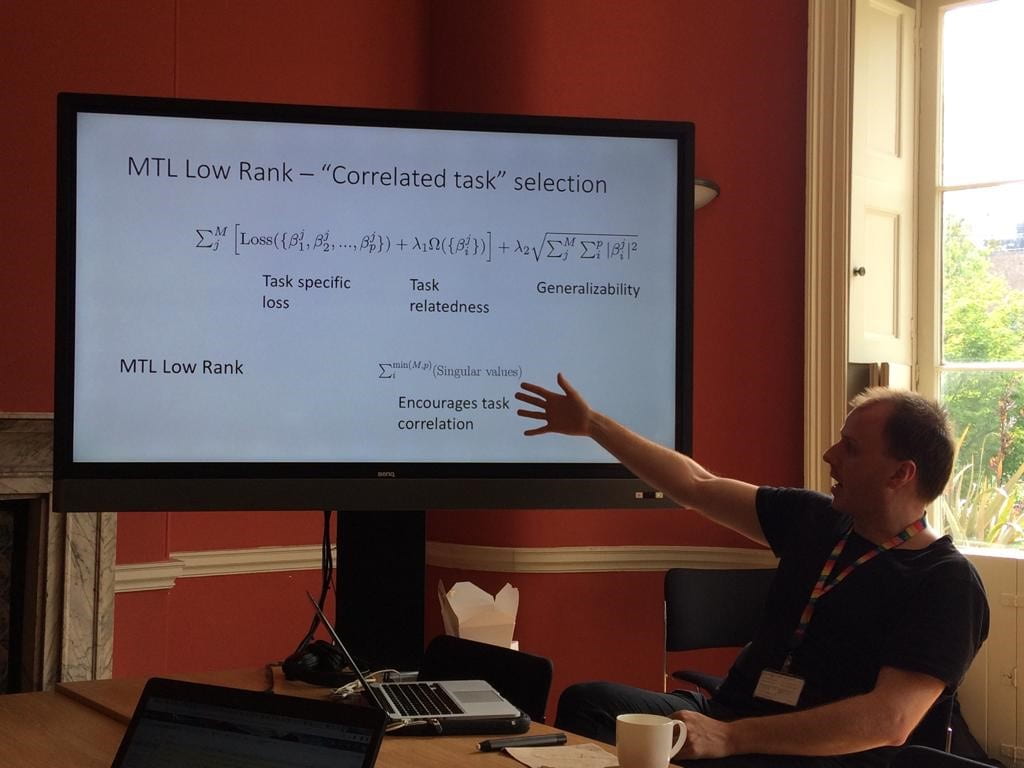
Multitask learning (MTL) is a statistical technique that aims to relate different “tasks” in order to improve how we perform those tasks separately and to understand how the tasks are related. MTL has been used in many different areas from improving image recognition and to help diagnose neurodegenerative diseases. In this project we wanted to see if MTL could be used to help better understand the OH-STAR data and also to sketch out ideas for potential grant applications to develop this idea further.

To evaluate MTL for our purposes, we focused our attention on two small subsets of the OH-STAR data: 600 faecal samples from pre-weaned young calves and 1800 from adult dairy cows. Each of these samples had been tested to see whether the Escherichia coli. bacteria within them contained the CTX-M  gene. This gene is important because it confers resistance to a range of antibiotics such as penicillin-like  and cephalosporin antibiotics which are used to treat a range of different infections  in humans and cattle.

In order to model the risk of something occurring, statisticians use a technique called logistic regression. With this technique you can quantify by how much a risk factor, e.g. which antibiotics a farmer may use,  increases or decreases the risk of observing the CTX-M gene in samples from the farm. As an example, consider how one of our risk factors, atmospheric temperature, affects the risk of observing CTX-M. Each dot on the chart below represents one of our samples, whether it had CTX-M (right hand axis), and the temperature when the sample was recorded (horizontal axis). The results of the logistic regression are the black line (left hand axis): the risk of observing CTX-M as the temperature increases.

How atmospheric temperature affects the risk of observing CTX-M

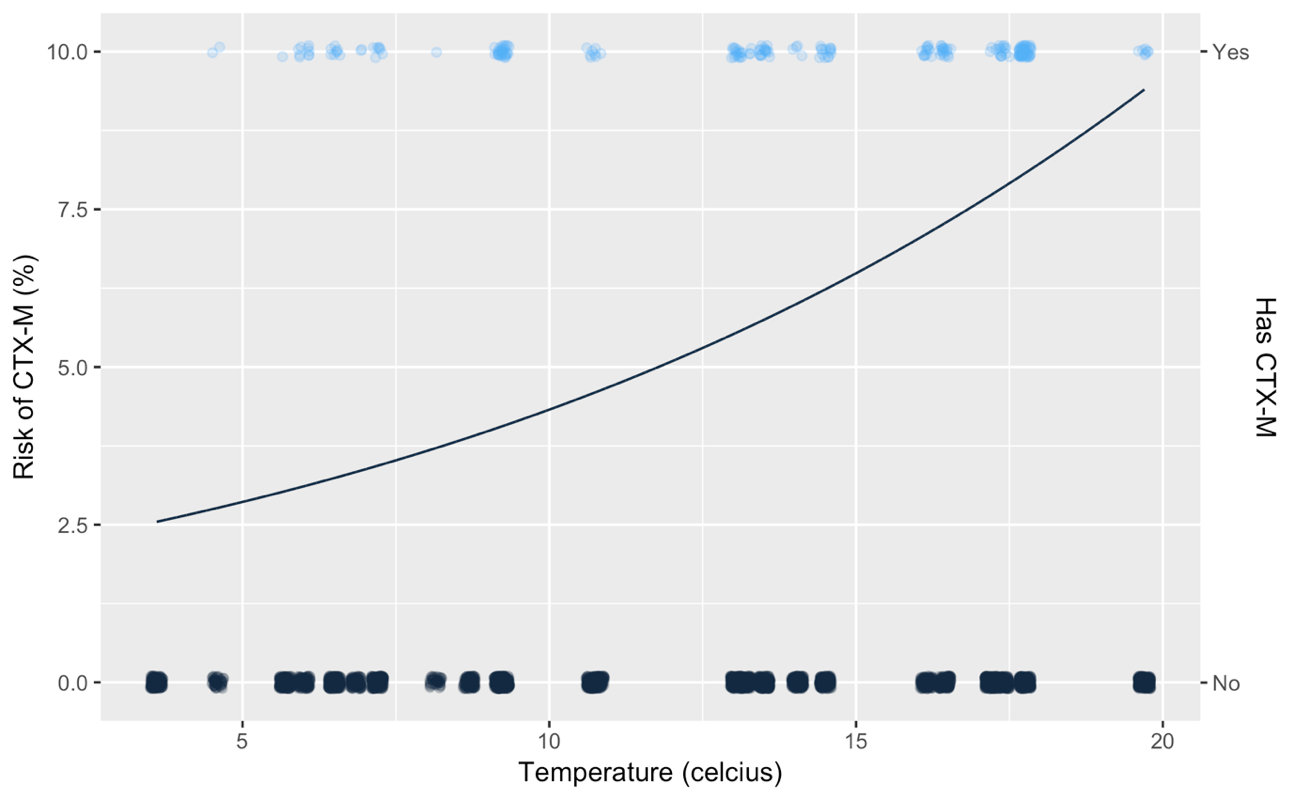
This relationship can be summarised by a single number called the log-odds-ratio, in this case the log-odds-ratio of temperature is 0.4. The fact that this number is greater than 0 means the temperature increases the risk of CTX-M, if it were less zero this means that it decreases the risk.

So, to quantify how each of the measured risk factors affects the risk of observing CTX-M we could just use logistic regression on all 300 risk factors for both the adults and separately for the calves  and look at the log-odds-ratios for each risk factor. This approach suffers from two problems however:

  1. by fitting a standard logistic regression model with 300 risk factors and at most 1800 observations means your conclusions won’t necessarily be correct for a wider population (because of overfitting)
  2. this approach treats understanding risk in adults and heifers as two separate tasks, when in fact they share many similarities.

To overcome the first problem statisticians use a technique called regularization. In a nutshell this reduces the complexity of your model to prevent it predicting random points (“noise”) in your data and focuses the model on predicting the “true” signal.

Multi-task learning (MTL) is an approach to overcoming the second problem. The idea is that some risk factors will pertain more to calves than to adults (e.g. the type of antibiotics given when they are young) or vice versa. So it makes sense for these risk factors to have different impacts on the model. However, there are some risk factors that will have very similar effects on both types of animal (e.g. outside temperature ). The way MTL relates tasks is complicated but it is very similar to the regularization technique linked to above. Interested readers can read reviews of MTL in A brief review on multi-task learning and An overview of multi-task learning in deep neural networks.

We looked at a number of different MTL techniques using the R package RMTL (package and accompanying paper) but for brevity we will consider only one here. Our two ‘tasks’ were logistic regression to find the risk factors affecting pre-weaned calves (task 1, labelled ‘heifers’) and adults (task 2).

The technique I’d like to talk about here is called ‘Joint feature learning’ and relates the tasks by encouraging them to have similar values for each risk factor. This means that if they’re not important for both, they will feature less strongly in each model. The results are shown below for the results with (right) and without (left) MTL.

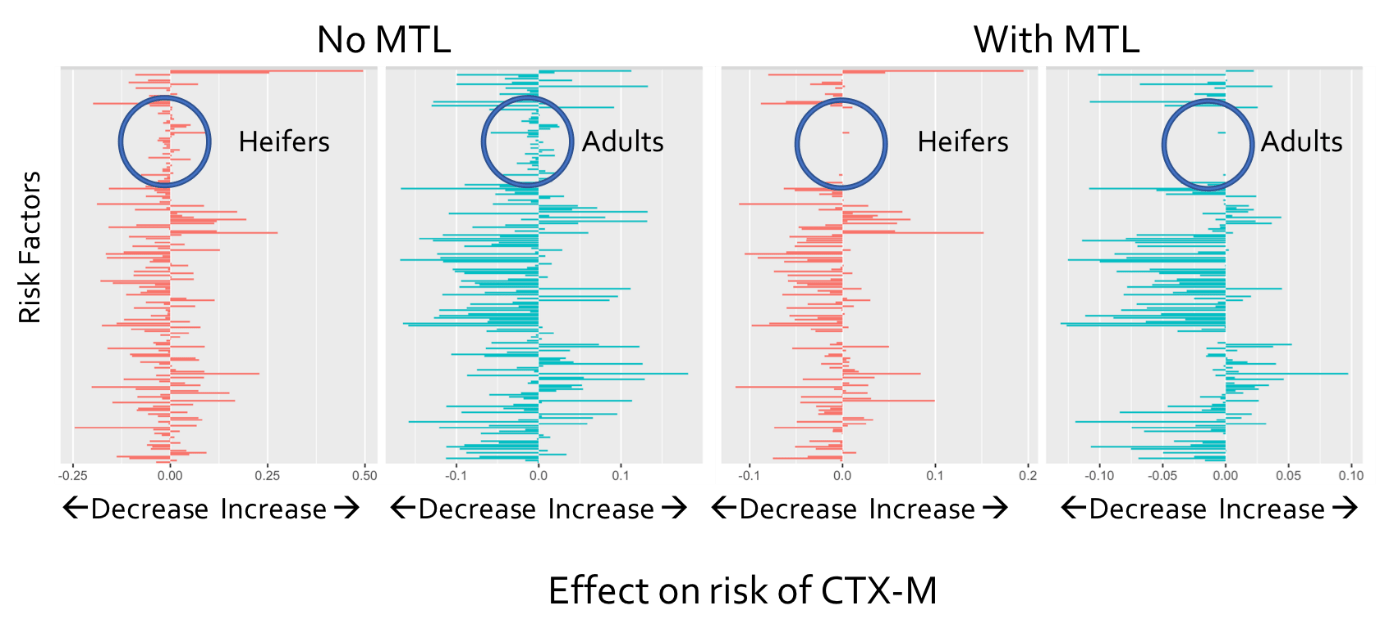
The red results are for heifers and the blue results are for the adults. Each bar denotes the effect of a risk factor on the risk of observing CTX-M: positive increases the risk while negative decreases the risk. The effect of using MTL was to suggest that the circled risk factors were not important to both tasks as applying MTL made all those risk factors irrelevant to the task. This was important for two reasons.

First, this cut down on the number  of possible risk factors that needed further investigation. Second, this meant that those risk factors which did show up as having different effects on the risk could be trusted as not being down to just chance. For example, temperature was one of the most important features for the heifers but not for the adults – this could provide ideas for interesting hypotheses to test in future work.

MTL has potential novel applications in real world scenarios

The main conclusion from this work is that MTL has potentially novel applications in complicated “real-world” scenarios but that the tools for MTL need developing. For example the techniques in the RMTL package did not fully take into account the structure of the data. This is something that will need to be addressed in any future work.

In our wrap up meeting we discussed the potential for using these techniques in future work. The main idea discussed was to use data collected as part of a completely separate project to help understand risk in OH-STAR data and vice versa. For example, the One Health drivers of AMR in rural Thailand (OH-DART) is a similar project, funded by the Global Challenges Relief Fund (GCRF). The distinct but related datasets from OH-STAR and OH-DART projects could be analysed jointly using MTL to identify risk factors. Thanks to the funding from the JGI we now have the materials necessary to write such a proposal and we will be watching calls from e.g. the GCRF and BBSRC in the near future to fund this work.

All of our code for this work can be found on the Open Science Framework.

The Jean Golding Institute seed corn funding scheme

The JGI offer funding to a handful of small pilot projects every year in our seed corn funding scheme – our next round of funding will be launched in the Autumn of 2019. Find out more about the funding and the projects we have supported.


Interactive visualisation of Antarctic mass trends from 2003 until present

Image of the calving front of the Brunt Ice Shelf, Antarctica. Image Credit: Ronja Reese (distributed via imaggeo.egu.eu), available under a Creative Commons Licence.

Blog written by Dr Stephen Chuter, Research Associate in Sea Level Research, School of Geographical Sciences, University of Bristol

This project was funded by the annual Jean Golding Institute seed corn funding scheme.

Antarctica and sea level – a grand socioeconomic challenge

Global sea level rise is one of the most pressing societal and economic challenges we face today. A rise of over 2 m by 2100 cannot be discounted (Ice sheet contributions to future sea-level rise from structured expert judgement), potentially displacing 187 million people from low-lying coastal communities. As a major and increasing contributor to global sea level rise, it is of critical importance to understand and quantify trends in the mass of the Antarctic Ice Sheet. Additionally, effective communication of this information is vital for policy makers, researchers and the wider public.

Combining diverse observations requires new statistical approaches

The Antarctic Ice Sheet is larger in area than the contiguous United States, meaning the only way to get a complete picture of its change through time is by using satellite and/or airborne remote sensing to supplement relatively sparse field observations. Combining these datasets is a key computational and statistical challenge due to the large data volumes and the vastly different spatial and temporal resolutions of different techniques. This challenge, which continues to grow as the length of the observation record increases and as new remote sensing technologies provide ever higher resolution data, requires new and novel statistical approaches.

We previously developed a Bayesian hierarchical modelling approach as part of the NERC-funded RATES project, which combined diverse observations in a statistically-rigorous manner. It allowed us to calculate the total mass trend at an individual drainage basin scale, in addition to the relative contribution of the individual component processes driving this change; such as variations in ice flow or snowfall. Being able to study the spatial and temporal pattern of the component process allows researchers to better understand what the key external drivers of ice sheet change are, which becomes critical when making predictions regarding about its future evolution.

Project goals

Our current work is aiming to achieve two major goals:

  1. Develop the Bayesian hierarchical framework and incorporate the latest observations in order to extend the mass trend time series until as close as possible to the present day.
  2. Synthesise the results in an easily accessible web application, so that users can interrogate and visualise the results at a variety of spatial scales.

The first of these goals is critical to providing model and dataset improvements, paving the way for the framework to be used over longer time series in order to better understand multi-decadal processes. The second goal, funded by the JGI seed corn award, is to provide these outputs in a manner that is easily used and understood by a range of stakeholders:

  • Scientists – Ability to use the latest available results within their own research and as part of large international collaborative inter-comparisons (e.g. World Climate Research Programme).
  • Policy makers – Allows easy interrogation of the results and have an accessible overview of the methodology. This will allow for project outputs to be easier included as evidence in policy making decisions.
  • General public – Generate public interest in the research output, the method used and raise awareness of the potential impacts of climate change on ice sheet dynamics.

Results

To date we have extended mass trends for the Antarctic Ice Sheet up to and including 2015. This has enabled us to see the onset of dynamic thinning (changes in mass due to increased ice flow into the ocean) over areas previously considered stable such as the Bellingshausen Sea Sector and glaciers flowing into the Getz Ice Shelf.

Rates of elevation change due to ice dynamic processes from 2003 – 2015
Time series of annual mass trends for the Antarctic ice sheet from 2003 – 2015

The cyan line represents total ice sheet mass change, the orange line represents changes due to ice dynamics (variations in ice flow) and the purple line represents changes in mass due to surface processes (variations in mass due to changes in precipitation and surface melt). The shaded areas around each line represent the one standard deviation uncertainty.  

In order to disseminate these results, a new web application has been developed. This allows users to interactively explore and download the updated results. Additionally, the web application features a second interactive page, aimed at the public and policy makers, which provides an overview of the datasets used in this work 

Future plans

The project has allowed us to make key advances in this methodology, laying the foundations for extending the time series nearer to the present dayFuture plans include incorporating additional observations from the new ICESat-2 and GRACE follow-on satellite missionsUltimately, the extended time series will be an important input dataset for the GlobalMass ERC project, which aims to take the same statistical approach to study the global sea level budget.  

The creation of the web application will allow for future updates to be quickly communicated, which allows our results to be incorporated in related research or policy making decisions. We hope to extend the web application functionality further to include more outputs from the GlobalMass project. 

The Jean Golding Institute seed corn funding scheme

The JGI offer funding to a handful of small pilot projects every year in our seed corn funding scheme – our next round of funding will be launched in the Autumn of 2019. Find out more about the funding and the projects we have supported.

Guide to safeguarding your precious data

Blog written by Jonty Rougier, Professor of Statistical Science.

Data are a precious resource, but easily corrupted through avoidable poor practices. This blog outlines a lightweight approach for ensuring a high level of integrity for datasets held as computer files and used by several people. There are more hi-tech approaches using a common repository and version control (e.g. https://github.com/), but they are more opaque.

If this approach is accompanied by this document (in the same folder) then there should be no loss of continuity if there are personnel changes. It might be helpful to create a file README stating: See *_safeguarding.pdf for details about how these files are managed.

The first point is the most important one:

1. Appoint someone as the Data Manager (DM). All requests for datasets are directed ‘upwards’ to the DM: do not share datasets ‘horizontally’. The DM may respond individually to dataset requests, or they may create an accessible folder containing the current versions of the datasets (see below).

The following points concern how the DM manages datasets:

2. Each dataset is a single file, with a name of the form DSNAME.xlsx (not necessarily an Excel spreadsheet, although this is a common format for storing datasets). At any time, there is a single current version of each dataset, with the name yyyymmdd_DSNAME.xlsx; the prefix yyyymmdd shows the date at which this file became the current version of DSNAME.xlsx. The current version is the one which is distributed. Everyone should identify their analysis according to the full name of the current version of the dataset. This makes it easier to reproduce old calculations, and to figure out why things work differently when the dataset is updated.

3. The DM never opens the current version. They simply distribute it (including to themself, if necessary). This is very important for spreadsheets, where every time the file is opened, there is the risk that entries in the cells will be inadvertently changed. Typically, though, new data will need to be added to DSNAME.xlsx, and corrections made. These changes are all passed upwards to the DM; they are not made on local versions of DSNAME.xlsx.

4. Incorporating changes. As well as current versions with different date prefixes, there will also be a development copy, named dev_DSNAME.xlsx. All changes occur in dev_DSNAME.xlsx. I recommend that each change to dev_DSNAME.xlsx is described by a sentence or two at the top of the file changes_DSNAME.txt. This file is made available alongside the current version of the dataset.

5. Updating the current version. When the changes in DSNAME.xlsx have become sufficient to distribute, it is copied to become the new current version, with an updated date prefix. The DM should alert the team that there is an update of DSNAME.xlsx. If the changes are being logged, insert the name of the new current version as a section heading at the top of changes_DSNAME.txt so that it is clear how the new current version differs from the old one.

6. If there is a crisis in DSNAME.xlsx then the DM should delete it, create a new dev file from the current version, and remake the changes. Crises happen from time to time, and it is a good idea not to accumulate too many changes in the dev file before creating a new current version. On the other hand, it can be tedious for people to be constantly updating their version for only minor changes. So the DM might want to create ‘backstop’ versions of the dev file for their own convenience, perhaps named backstop_DSNAME.xlsx, which also requires a line in changes_DSNAME.txt if it is being used.

7. The DM is responsible for backing up the entire folder. This folder contains, for each dataset: all of the current versions (with different date prefixes), the dev file, the changes file if it exists (recommended), and additional helpful files like a README. An obvious option is to locate the entire folder somewhere where there are automatic back-ups, but it is still the DM’s responsibility to know the back-up policy, and to monitor compliance; even to run a recovery exercise. It’s a bit ramshackle, but regularly creating a tar file of the folder and mailing to oneself is a pragmatic safety net.

Cog X 2019: The Festival of AI and Emerging Technology – 10-12 June 2019

Blog written by Patty Holley, Jean Golding Institute Manager.

Mayor of London Sadiq Khan

CogX 2019 took place during the first half of London Tech Week in the vibrant Knowledge Quarter of Kings Cross in London. The conference started only 3 years ago, yet this year hosted 15,000 attendees and 500 speakers making it the largest in Europe. CogX 2019 was also supporting 2030 Vision in their ambitions to deliver the Sustainable Global Goals. Mayor of London Sadiq Khan opened the conference with a call for companies to be more inclusive by opening up opportunities for women and the BAME communities, helping London and other cities to find solutions for societal problems.

Here are some highlights:

The State of Today – Professor Stuart Russell

Professor Stuart Russell, University California, Berkeley

The first keynote delivery was from Professor Stuart Russell from University of California, Berkeley where he described the global status of data science and AI. There has been a major investment across the world in the development of these technologies and academic interest has also increased over time. For example, there has been a significant increase from 2010 to 2015 in rate recognition in ImageNet, a dataset of labeled images taking from the web. Learning algorithms are improving constantly but there is a long way to go to reach human cognition. Professor Russell had a cautionary message particularly in autonomous technology as the predicted progress may not be achieved as expected.

Professor Russell also suggested that probabilistic programming and mathematical theory of uncertainty can really make an impact. As an example, he talked about the global seismic monitoring for the comprehensive nuclear test-ban treaty. Evidence data is compared with the model daily, and the algorithm detected the North Korean test in 2013.

What is coming… Robots, personal assistants, web-scale information and extraction and question answering, global vision system via satellite imagery. However, Professor Russell believes that human level AI has a long way to go. Major problems, like the capability of real understanding of language, integration of learning with knowledge, long range thinking at multiple levels of abstraction, cumulative discovery of concepts and theories, all haven’t as yet been resolved.

Finally, Professor Russell added that data science and AI will drive an enormous increase in the capabilities of civilization, however, there are a number of risks, including democracy failures, war and attacks on humanity, so regulation and governance are key.

Gender and AI

Clemi Collett and Sarah Dillon, University of Cambridge

The talks took place in several venues across Kings’ Cross, and on the ‘Ethics’ stage, Sarah Dillon and Clemi Collett from University of Cambridge highlighted the problems with dataset bias. The issue of algorithm bias has been highlighted previously, but not the bias that may come from the actual data. Guidelines are not content or context specific. They suggested that gender specific guidance is needed, guidance on data collection and data handling, theoretical definition of fairness based on current and historic research that will take into account societal drivers, for example to investigate why some parts of society don’t contribute to data collection.

Importantly, the speakers also talked about the diversity of the workforce working in these technologies. Currently, only 17% are female, which really impacts on the technology design and development. Diversification of workforce is vital as it brings discussion within teams and companies. If this issue is not challenged, then existing inequalities will be aggravated. The speakers reiterated the need to investigate the psychological factors that affect diversity in this labour market through qualitative and quantitative research. A panel followed the talk, which included Carly Kind, Director of Ada Lovelace Institute, Gina Neff, University of Oxford, Kanta Dihal, Centre for the Future of Intelligence, University of Cambridge. Carly Kind pointed out that diversity (or lack of) will shape what technologies are being developed and used. Gina Neff highlighted the point that most jobs at risk of automation are those associated with women, and therefore gender equality in the workforce generating new tech is a necessity. One important area that should be encouraged is the interdisciplinary exchanges between gender theorists and AI practitioners and to develop novel incentives for women to encourage involvement in tech. Women need to be part of the decision making process, and support those that can become role models, building profiles that will inspire women.

The Future of Human Machine Interaction

Mark Sagar, Soul Machines

The ‘Cutting Edge’ stage hosted those working on the future of some of the cutting edge technologies. On Human Machine interaction, the conference invited three companies to talk about their current work and future ideas. Mark Sagar from Soul Machines, previously worked on technology to bring digital characters to life in movies like Avatar. Mark talked about the need of the mind to be part of a body and suggested that the mind needs an entire body to learn and interact. To develop better cooperation with new technologies, humans will need a better face-to-face interaction as human reactions are created by a feedback loop using verbal and non-verbal communication and thus, Soul Machines aims to build digital brains in digital bodies. The model learns through lived experiences, learning in real time. Mark demonstrated one example of a new type of avatar, a toddler avatar to demonstrate how digital humans are able to learn new skills. This technology aims to create digital systems and personal assistants that will interact with humans and learn from those interactions.

Sarah Jarvis, and engineer from Prowler.io explained how their platform uses AI to enable complex decision making using probabilistic models. Probability theory is at the core of the technology that is currently being used in finance, logistics and transport, smart cities, energy markets and autonomous systems.

Eric Daimler, CEO, Spinglass Ventures observed that there is a constraint on data availability and quality rather than data science technology. A large problem is lack of large verifiable datasets. This challenge will increase due to concerns about privacy and security. For example, social media has moved to request more regulation. There are limitations on data integration, a gap in theory and practice. Finally Eric suggested that the future brings a new era category theory that could replace calculus.

Edge Computing

Next on the ‘Cutting Edge’ stage we had speakers providing views on Edge computing. Ingmar Bosner Professor of applied AI at the Oxford Robotic Institute, talked about combining edge computing (moving computation closer to where it is being used) and deep learning. Ingmar is interested in challenges such as machine introspection in perception and decision making, data efficient learning from demonstration, transfer learning and the learning of complex tasks via a set of less complex ones. Ingmar explained how these technologies may be effectively combined in driverless technologies. Using a very simplistic method, a sat nav app could integrate with the training data to control driverless cars. In addition, the system uses simulated data to train the models and can translate into better responses in real world scenarios. Joe Baguley from MVware, providers of networking solutions, describe the current idea of taking existing technologies and putting them together to solve novel challenges, i.e. driverless cars. Automation is no longer an optimization but a design requirement and new developments in technologies mean that AI and ML can be used to manage the use of applications across platforms and networks. AI can also be used to optimise those models making them more energy efficient, for example, by making sure that only the necessary data is kept and not data that can be considered wasteful.

How Technology is Changing our Healthcare

Mary Lou Jepson  from Open Water,  a startup working on fMRI-type imaging of the body using holographic, infrared techniques, described how her discovery will offer affordable imaging technology. Samsung’s Cuong Do, who directs the Global Strategy Group described their work developing a 24/7 AI care advisor. The aim of the technology is to support medical efforts and provide an efficient alternative that can alleviate the healthcare system. A game changer use of AI will open the possibility of using biomedical data to personalize and improve the efficacy of medicine. Joanna Shields from BenevolentAI is applying technologies to transform the way medicines are discovered, developed, tested and brought to market.  Meanwhile, Sunil Wadhwani, the CEO of the multimillion dollar company IGATE Corp, is helping not-for-profit organizations to scale technologies in healthcare, leading the innovation in primary service health providers in India, applying AI to benefit those that need it the most. The panel discussed how there is an increased gap between life span and health span, with financial position being the main driver for this gap.  Technology may be able to help close the gap and help train the next generation of health practitioners, optimizing drug creation and delivery and developing cost-effective healthcare for the poorest in society. In the era of data, this can provide an advantage, as personalised data does not only include DNA but where people live, dietary information and environmental data, which brings new opportunities to develop solutions for chronic conditions. Johanna, added that “the healthcare of humans is the best and most complicated machine learning and AI challenge”.

Research Frontiers

The Alan Turing Institute hosted a stage at Cog X this year, more information about speakers and content is available on the Turing website.

Back again at the ‘Cutting Edge’ stage Robert Stojnic recommended a curated site to check the state of the art developments in ML, Papers with Code

Jane Wang’s presentation

Jane Wang, from DeepMind, explained why causality is important for real world scenarios. Jane talked about how reasoning develops in humans, when does it show up?  4 to 5 year olds can make informative interventions based on causal knowledge, sometimes better than adults, as adults have prior knowledge (bias). Jane discussed the possibility of meta learning (”learning to learn”) by learning these priors as well as task specifics. This approach may enable AI to learn causality.

The next speaker was Peader Coyle from Aflorithmic Labs, who is contributing to the online course on probabilistic programming. He talked about the modern Bayesian workflow, and suggested that lots of problems are ‘small’ or ‘heterogeneous’ data problems when traditional ML methods may not work. He is part of the community supporting the development of Probabilistic programming in Python.

Ethics of AI

Joanna Bryson, University of Bath

Increasingly there has been a worrying trend to use data science technologies to perpetuate discrimination, increase power imbalance, and support cyber corruption and a key aspect of the conference was the commitment to incorporate ethical considerations to technology development. On the ‘Ethics stage’ Professor Joanna Bryson from Bath University and one of the leading figures of the Ethics of AI, talked about the advances in the field. Recently, the OECD has published their principles on AI,  to promote artificial intelligence (AI) that is innovative and trustworthy and that respects human rights and democratic values. There is a pressing need for ethics in sustainable AI, for example by looking at bias in data collections process, not just the algorithms. One way to achieve this is by changing incentives, for example, Github can grant stars to those projects that integrate ethics very clearly in their pipeline. Most of the research in the field has been done in silo, sometimes, without addressing the impact, ethical guidelines recommend to closely link research and impact. One very important aspect of this topic is the issue of diversity, as people’s background will affect the outputs in the field. Another important aspect of fairness in this area has been the drive to support open source software However, the community now has a challenge to develop strategies for sustainability.

Data Trusts

Exploring Data Trust

A significantly different approach to data rights, was addressed in the discussion ‘Data Trusts’ by Neil Lawrence, Chair in Neuro and Computer Science, University of Sheffield and Sylvie Delacroix, Professor of Law and Ethics, University of Birmingham and Turing Fellow. With GDPR, we as data providers have rights, but it’s not easy to organise who has our data and what they use it for – we often click ”yes” just to access a website. The speakers suggested the need of new type of entity that operates as a Trust. With this mechanism, data owners choose to entrust their data to data trustees who are compelled to manage the data according the aspirations of the Trusts’ members. As every individual is different, society needs an ecosystem of trusts, which people could choose and move between. This could provide meaningful choices to data providers, ensuring that everybody has to make a choice regarding how to use their data (e.g. economic value, societal value), and contributing to a growing the debate around data ownership.

It was a fascinating couple of days at CogX listening about the great advances in technology. A key message was that these developments need to be guided by the critical need for equality and the environmental challenges we face. Listening to the co-founder of Extinction Rebellion Gail Bradbrook was really an inspiration to continuously strive to use data science and AI for social good.

More information is available in their video channel.

Attendance at Cog X was funded by the Alan Turing Institute.


Introducing the University of Bristol’s Turing Fellows: Bill Browne

Our latest series of blogs introduces you to our University of Bristol’s Turing Fellows, where the Jean Golding Institute have been speaking to some of the thirty Alan Turing Institute Fellows to find out a little more about their work and research interests.

Last time we spoke to Philip Hamann, NIHR Clinical Lecturer in Rheumatology and Turing Fellow who spoke to us about his work developing artificial intelligence (AI) methods to monitor and manage individuals with rheumatoid arthritis remotely using remotely captured data from smartphones and wearables – you can read more about him on our previous JGI blog.

Next, we spoke to William (Bill) Browne, Professor of Statistics in the School of Education and Turing Fellow.

What are your main research interests? 

Professor William (Bill) Browne, Professor of Statistics, School of Education

I have always worked on statistical methods and software for realistically modelling data that has underlying dependence structure, and in particular hierarchical or multilevel structure. My research is often very collaborative focussing on specific problems in specific disciplines.

I am also interested in how to explain methods / create software for applied researchers and this has led recently to interests in automation of statistical modelling approaches and of teaching statistics.

Can you give a brief background of your experience?

I studied all my degrees in a Maths school (in Bath) and created the Monte Carlo Markov chain estimation engine within the MLwiN software package as part of my PhD. I then worked as a postdoc in the Centre for Multilevel Modelling (CMM) when it was based in London before holding academic posts in three different schools in turn – Mathematical Sciences in Nottingham and then Veterinary Science and Education in Bristol. While working in Education I also found time to be the first director of the Jean Golding Institute.

What are the big issues related to data science / data-intensive research in your area? 

Over my academic career multilevel modelling techniques have gone from being only available via specialist software to being available in standard software packages and used by researchers with less statistics background. The big issue is therefore to ensure that these tools are used appropriately and so training and potentially automation are important aspects of research in this area i.e. how can we ensure that applied researchers use complex statistical approaches appropriately? This question will become even more important looking at data science more generally given the growth in more ‘black box’ machine learning approaches which often perhaps don’t offer the transparency that statistical modelling does and this interests me as well.

Slide demonstrating software for automatic teaching material generation

Can you tell us of one recent publication in the world of data science or data-intensive research that has interested you?

One wish I always have is the time to read more and keep up with cutting edge developments while still also reading the education literature! I have a current project with Nikos Tzavidis in Southampton and Timo Schmid in Berlin looking at MCMC algorithms and software for Small Area Estimation. Nikos and Timo with colleagues last year have written a JRSS Series A read paper on frameworks for small area estimation which is a good read.

How interdisciplinary is your research? 

The nature of producing statistical software is that it gets used in all manner of disciplines and I enjoy it when google scholar sends me citation links to see what new disciplines have used our software and multilevel models. Of course having worked my last 3 jobs in different faculties has made my research even more interdisciplinary. 

What’s next in your field of research? 

I hope that more research will be done on how best to train applied researchers in cutting edge data science methods – both statistical and machine learning. I also believe more research into increasing the transparency of methods is called for i.e. it has always been easy to show via simulations that new method performs better than old methods for specific scenarios but perhaps harder to explain why this is true or indeed how generalisable this improvement is. 

If anyone would like to get in touch to talk to you about collaborations / shared interests, how can they get in touch?

I am happy to answer emails – william.browne@bristol.ac.uk and there is much more about the Centre for Multilevel Modelling on our website.

Are there any events coming up that you would like to tell us about? 

We will be running a workshop on small area estimation in July and details will soon appear on the CMM website. I have also recently produced a series of online training talks on our software development work for the National Centre for Research Methods which are free to view.


More about The Turing Fellows 

Thirty fellowships and twelve projects have been awarded to Bristol as part of the University partnership with the Turing. This fellowship scheme allows university academics to develop collaborations with Turing partners. The Fellowships span many fields including key Turing interests in urban analytics, defence and health. 

Take a look at the Jean Golding Institute website for a full list of University of Bristol Turing Fellows. 

The Alan Turing Institute

The Alan Turing Institute’s goals are to undertake world-class research in data science and artificial intelligence, apply its research to real-world problems, drive economic impact and societal good, lead the training of a new generation of scientists and shape the public conversation around data. 

Find out more about The Alan Turing Institute.