The symbolic annihilation of women in primary school literature.

JGI Seed Corn Funded Project

Blog post by Chris McWilliams, Tamzin Whelan, Roberta Guerrina, Fiona Jordan, Amanda Williams.

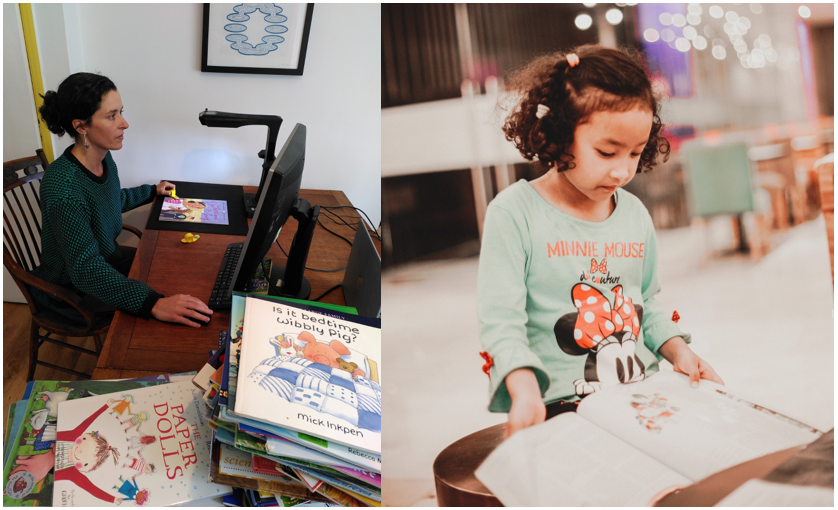
Figure 1: (left) Tamzin scanning books, running them through the OCR software and correcting the output; (right) a child reading an early years book.

Children are strongly impacted by the gender messages they receive at a young age, and books are integral to this messaging. The goal of this project is to examine the prevalence of gender stereotypes in Early Years Foundation Stage (EYFS) book collections available in school classrooms.

Specific aims of the project include:

  1. To create a machine learning tool that will analyse both the gender of the protagonists (making a distinction between human and non-human characters) and the language associated with the different genders;
  2. Use an interdisciplinary perspective to analyse patterns revealed by word frequency extraction, to gain a better understanding of how EYFS children’s books are reinforcing or challenging gender stereotypes;
  3. To produce reusable software and data science methods that can continue to be used to identify the prevalence of gender stereotyping in book collections. The intended users are teachers, parents and researchers.

Results

Our sample consists of 200 books from the reception class of a primary school in rural Devon. As in most schools, the collection was amassed over time and the date of first publication ranges from 1978-2020. So far, 130 of the 200 books have been scanned and processed. Initial findings suggest that within this collection there is a disproportionate representation of genders and characters are depicted in gender stereotypical ways.

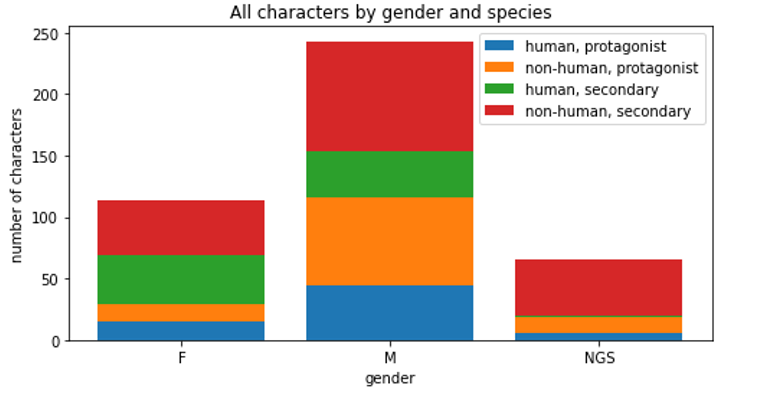
Figure 1.  The frequency of gender (female [F], male [M], non-gender specific [NGS]) and ‘species’ (human/non-human) of protagonists and secondary characters from 130 children’s story books.

There are two key findings to date:

  1. Gender Representation. By coding the gender (female, male, or non-gender specific) and species (human or non-human) of the protagonist and secondary characters in each storybook we were able to examine whether the genders were equally represented.

Unsurprisingly, they were not. The results are depicted in figure 1. Male characters outnumbered female characters at a rate of more than 2:1 (32% female characters in total). When females were included, they were far more likely to be represented as secondary characters than protagonists (75% of females were secondary characters, versus 52% for males).  This is important as it replicates the harmful stereotype of females occupying supporting roles.

2. Gender Stereotyping. Using Spacy to parse the sentence structure, we examined verb clauses where the noun-subject belonged to a standard list of female/male identifiers or was the name of a character with identifiable gender (manually coded).

From these sentences we then extracted the following words types and associated them with the gender of the noun-subject:

  • the verb associated with the noun subject in each sentence (Root)
  • nouns that are the object of the verb clause (Dobj)
  • adjectives associated with the noun subject (Amod and Acomp)

The results are summarised in figures 2 and 3, and in table 1 which shows that female characters have approximately half as many associated words across the three word types. This reveals a smaller vocabulary associated with female characters, suggesting that females are less relevant to plot lines and have less expansive narratives.

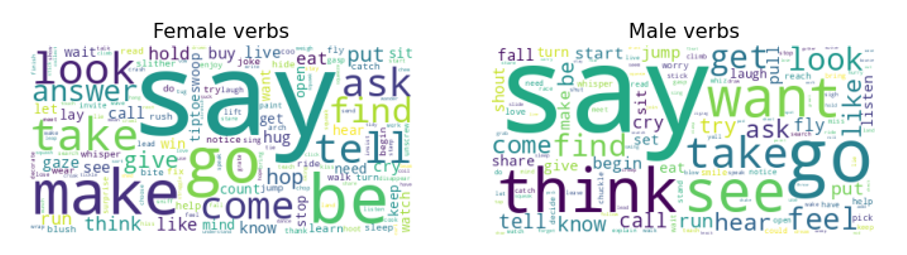
Figure 2: Word clouds showing the frequency of verbs associated with female and male characters.

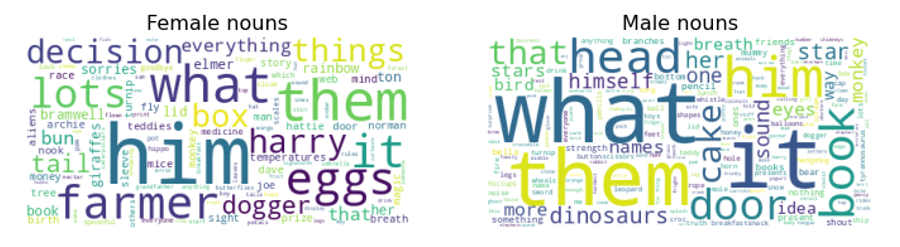
Figure 3: Word clouds showing the frequency of nouns associated with female and male characters.

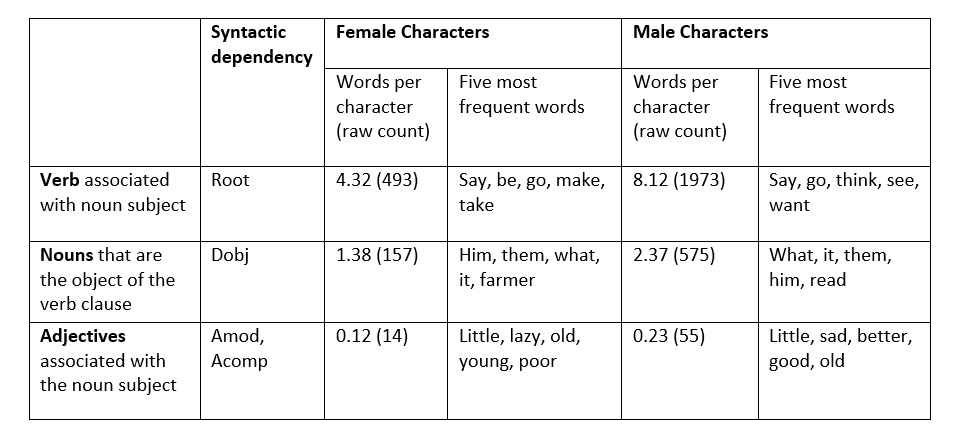
Table 1: Summary of word types associated with female and male characters. ‘Words per character’ is the average number of distinct words per character.

We are currently verifying the coding process, but initial findings demonstrate that gender stereotypes continue to be present in children’s literature. For example, verbs related to female characters are more passive, and verbs related to male characters are more active. Aligning with gender-based microaggressions, male characters tend to dominate the text, reaffirming masculinity as the norm. Female characters most frequently act on ‘him’ (table 1), indicating a centralisation of the male experience within the portrayal of female characters.  Furthermore, females predominate in caring roles with 25% of all female characters written as Mum, compared to 4% of males as Dad. This reproduces stereotypical divisions between public and private roles, situating females in the domestic sphere and males in the external world.

In summary, we find that female characters are not being represented equitably in this collection. When female characters are featured, they are more likely have minor roles and are more likely to perform stereotypically female roles.  Patriarchal socialisation at such an early age negatively impacts the way children understand society and their position within it. These findings demonstrate that through both the omission and portrayal of female characters, harmful gender stereotypes are indeed present in contemporary classroom libraries.

Future Plans

Encouragingly, there is increasing awareness that diversity and representation in children’s literature is problematic and some online resources and studies are drawing attention to this issue. In addition to expanding the dataset, developing the data science, and disseminating findings to academic audiences, we are keen to work with parents, teachers, and community partners to actually change what children are reading. This will be the foundation of a larger funding application – we look forward to updating the JGI community on our future successes in this area.

Please contact Chris McWilliams (chris.mcwilliams@bristol.ac.uk) for more information about the project.

“climatearchive.org”: 540 million years of climate history at your fingertips

JGI Seed Corn Funded Project

We created a web application that enables interactive access to climate research data to enhance scientific collaboration and public outreach. 

Screenshot of the app showing surface ocean currents (coloured by magnitude) of the present-day Atlantic Ocean.

Climate model data for everyone 

We can only fully understand the past, present and future climate changes and their consequences for society and ecosystems if we integrate the expertise and knowledge of various sub-disciplines of environmental sciences. In theory, climate modelling provides a wealth of data of great interest across multiple disciplines (e.g., chemistry, geology, hydrology), but in practice, the sheer quantity and complexity of these datasets often prevent direct access and therefore limit the benefits for large parts of our community. We are convinced that reducing these barriers and giving researchers intuitive and informative access to complex climate data will support interdisciplinary research and ultimately advance our understanding of climate dynamics.  

Aims of the project 

This project aims to create a web application that provides exciting interactive access to climate research data. An extensive database of global paleoclimate model simulations will be the backbone of the app and serves as a hub to integrate data from other environmental sciences. Furthermore, the intuitive browser-based and visually appealing open access to climate data can stimulate public interest, explain fundamental research results, and therefore increase the acceptance and transparency of the scientific process. 

Technical implementation 

We developed a completely new, open-source application to visualise climate model data in any modern web browser. It is built with the JavaScript library “Three.js” to allow the rendering of a 3D environment without the need to install any plug-ins. The real-time rendering gives instantaneous feedback to any user input and greatly promotes data exploration. Linear interpolation within a series of 109 recently published global climate model simulations provides a continuous timeline covering the entire Phanerozoic (last 540 million years). Model data is encoded in RGBA colour space for fast and efficient file handling in mobile and desktop browsers. The seed corn funding enabled the involvement of a professional software engineer from the University of Bristol Research IT. This did not only help with transferring our ideas into a website but also ensured a solid technical foundation of the app which is crucial for future development and maintainability. In particular, a development workflow using a Docker container has been implemented to simplify sharing and expanding the app within the community. 

Screenshots of the app for the present day and the ice-free greenhouse climate of the mid-Cretaceous (~103 Million years ago). Shown are annual mean model data for sea surface temperature, surface ocean currents, sea and land ice cover, precipitation, and surface elevation

Current features 

The app allows the visualisation of simulated scalar (e.g., temperature and precipitation) and vector fields (winds and ocean currents) for different atmosphere and ocean levels. The user can seamlessly switch between a traditional 2D map and a more realistic 3D globe view and zoom in and out to focus on regional features. The model geographies are used to vertically displace the surface and to visualise tectonic changes through geologic time. Winds and ocean currents are animated by the time-dependent advection of thousands of small particles based on the climate model velocities. This technique – inspired by the “earth” project by Cameron Beccario – greatly helps to communicate complex flow fields to non-experts. Individual layers representing the ocean, the land, the atmosphere, and the circulation can be placed on top of each other to either focus on single components or their interactions. The user can easily navigate on a geologic timescale to investigate climate variability due to changes in atmospheric CO2 and paleogeography throughout the last 540 million years. 

Next steps 

The first public release of the “climatearchive.org” app is scheduled for autumn 2021. This version will primarily showcase the technical feasibility and potential for public outreach of the app. We anticipate using this version to acquire further funding for developing new features focusing on the scientific application of the website. First, we plan to add paleoclimate reconstructions (e.g., temperature) for available sites across geologic time. The direct comparison with the simulated model dynamics will be highly valuable for assessing the individual environmental setting and ultimately interpreting paleoclimate records. Secondly, we will generalise the model data processing to allow the selection and comparison of different climate models and forcing scenarios. Thirdly, we aim to provide the ability to extract and download model data for a user-defined location and time. We see the future of the app as a user-friendly interface to browse and visualise the large archive of available climate data and finally download specific subsets of data necessary to enable quantitative interdisciplinary climate research for a larger community. 

Contact details and links 

Sebastian Steinig, School of Geographical Sciences 

sebastian.steinig@bristol.ac.uk 

The public release of the website (https://climatearchive.org/) and source code (https://github.com/sebsteinig) is scheduled for autumn 2021. 

Digital Twin for Infrastructure: Building an Open-Interface Finite-Element Model of the Clifton Suspension Bridge (Bristol)

JGI Seed Corn Funded Project

Much of the global infrastructure is now operating well outside its designed lifetime and usage. New technology is needed to allow the continued safe operation of this infrastructure, and one such technology is the ‘Digital Twin’.

A Digital Twin for Infrastructure

A Digital Twin is a mathematical model of a real object, that is automatically updated to reflect changes in that object using real data. As well as being able to run simulations about possible future events, a Digital Twin of a structure also allows the infrastructure manager to estimate values about the real object that cannot be directly measured. To deliver this functionality, however, the modelling software must be able to interface with the other components of the Digital Twin, namely the structural health monitoring (SHM) system that collects sensor data, and machine learning algorithms that interpret this data to identify how the model can be improved. Most commercial modeling software packages do not provide these application interfaces (APIs), making them unsuitable for integration into a Digital Twin.

A Requirement for Open Interfaces

The aim of this project was to create an ‘open-interface’ model of the Clifton Suspension Bridge (CSB), that will form one of the building blocks for an experimental Digital Twin for this iconic structure in Bristol (UK). Although structural models of the CSB exist, they are limited in both functionality and sophistication, making them unsuitable for use in a Digital Twin. For a Digital Twin to operate autonomously and in real-time, it must be possible for software to manipulate and invoke the structural model, tuning the model parameters based on the observed sensor readings.

The OpenSees finite element modeling (FEM) software was selected for the creation of the Digital Twin ready model, as it is one of the few pieces of open-source structural modeling software that has all the necessary APIs.

A finite element model of the Clifton Suspension Bridge, showing the relative elevation of the bridge deck and the length. Produced by Elia Voyagaki

Building the Model

Our seed corn funding has enabled the creation of an OpenSees-based FEM of the CSB. The information needed for this process has been gathered from a number of different sources, including multiple pre-existing models, to produce a detailed FEM of the bridge. The precise geometry of the CSB has been implemented in OpenSees for the first time, paving the way for the creation of a Digital Twin of Bristol’s most famous landmark.

Some validation of this bridge geometry has also been carried out. This validation has been done by comparing the simulated bridge dynamics with real world structural health monitoring data, collected from the CSB during an earlier project (namely the Clifton Suspension Bridge Dashboard). The dynamic behaviour of a bridge can be understood as being made up of many different frequencies of oscillation, all superimposed over one another. These ‘modes’ can be measured on the real bridge, and by comparing their shape and frequency with the simulated dynamics produced by the model it is possible to assess the model’s accuracy. Parameters in the model can then be adjusted to reduce the difference between the measured and modelled bridge dynamics. It is this process that can now be done automatically, thanks to the open interfaces between the model and the sensors’ data.

Illustration of the sensor deployment carried out as part of the Clifton Suspension Bridge Dashboard project. Base image from Google Maps.

Fitting the Pieces Together

The creation of this open-interface model will enable a new strand of research into Digital Twins, which will tackle some of the challenges that must be overcome before the technology can deliver insights to infrastructure managers. The CSB is currently being instrumented with a range of structural sensing infrastructure, turning it into a ‘living lab’ as part of the UKCRIC project’s Urban Observatories (UO) endeavour. The structural health monitoring system being developed for this living lab will also have all the APIs required for integration into a Digital Twin, providing access to both real-time and historic structural dynamics data, as well as information about the loading applied to the bridge through wind, vehicles and changes in temperature.

With both the sensing and modeling components of the Digital Twin developed, we will be in a position to start addressing the many technical challenges associated with automatic model updating. For example, modifying the model to match recorded data is an inverse problem, and with an FEM containing many thousands of different parameters there may be many different model configurations that match the observed sensor data. Developing an algorithm able to select the configuration that best represents the physics of the real object is a significant challenge, but this seed corn funding has allowed us to create a testbed that enables the scientific community to explore these challenges.

About Sam Gunner, the Author and PI on the project: Sam is an electronics and systems engineer within the Bristol UKCRIC UO team. He has developed and deployed distributed sensing systems for a range of different applications, from historic bridges to modern electric bicycles. As well as the technical changes involved in this, Sam’s research focuses on how technology can be used most effectively, to support these operational systems.

Email: sam.gunner@bristol.ac.uk

About Elia Voyagaki, a Co-I on the project: Elia is a PDRA with outstanding modelling experience who has previously worked with OpenSees. EV has a significant understanding of the structure of the Clifton Suspension Bridge thanks to her work on the CORONA project.

About Maria Pregnolato, a Co-I on the project: Maria is a Lecturer in Civil Engineering and EPSRC Research Fellow at the University of Bristol. Her projects within the Living with Environmental Change (LWEC) area investigate the impact of flooding on bridges and transportation.

Also involved in the Project, out Dr Raffaele De Risi, also involved in the project: Raffaele is a Lecturer in Civil Engineering. His research interests cover a wide range of academic fields, including structural reliability, engineering seismology, earthquake engineering, tsunami engineering, and decision-making under uncertainty.

Understanding the risk of cancer after SARS-CoV-2 infection

JGI Seed Corn Funded Project

Viral infections have the potential to alter cell’s DNA, activating carcinogenic processes and preventing the immune system from eliminating damaged cells. Since the COVID19 pandemic began there is an urge to understand the long-term health impact of SARS-CoV-2 and how it may increase the risk of cancer. 

Aims of the project

In this pilot study we used the graph database EpiGraphDB (Liu et al, Bioinformatics, 2020), an analytical platform to support research in population health data science, to link the recently mapped host-coronavirus protein interaction in SARS-CoV-2 infections with the existing knowledge of cancer biology and epidemiology. 

The main objectives of this project are: 

  • The integration of specialized data sources: the SARS-CoV-2 protein interaction map (Gordon et. al, Nature, 2020), genetic risk factors of critical illness in COVID-19 (Erola-Pairo, Nature,2021), and cancer genes (Lever et. al, Nature Methods, 2019). 
  • The reconstruction of an accessible network of plausible molecular interactions between viral targets, genetic risk factors, and known oncogenes, tumour suppressor genes and cancer drivers for relevant cancer types. 

Results

Coronaviruses are known to target the respiratory system. We have reconstructed the molecular network for lung cancer risk, as many patients recovering from SARS-CoV-2 suffer from long-term symptoms due to damage of the walls and linings of the lungs. 

Network of the protein interactions between human gene preys targeted by SARS-CoV2, risk factors of critical illness, and known carcinogenic genes in lung cancer. 

We found 93 human genes targeted by SARS-CoV-2, represented in pink, which are oncogenic or interact with oncogenic genes. These were clustered based on high connectivity to enrich the network visualization, where each cluster is depicted as two columns, one for SARS-CoV2 interacting genes and one for cancer genes. Then we searched for molecular pathways that may be perturbed by each gene set. 

Our results suggest potential alterations in Wnt and hippo signalling pathways, two important pathways frequently linked to cancer due to their roles in cell proliferation, development and cell survival. The risk of perturbations in telomere maintenance and DNA replication may affect the integrity of the DNA favouring it’s degradation and preventing the repair of damaging events like gene fusions. There may also be a possible impact on gene function through changes in the mRNA splicing process, impeding translation into working proteins. 

We also integrated genetic risk factors of critical illness in COVID-19 into this network. Triangulating this evidence, we identified that genes IFNAR2 and TYK2 may interact with Interleukin 6 (IL6), an important gene in the regulation of host defence during infections. Also, the genetic risk factor NOTCH4 was linked to genes CCND1 and ERBB2, genes that participate in the regulation of the cell cycle and transcriptional regulation respectively, and have been associated with cancer metastasis and poor prognosis. 

Future plans for the project. 

This project highlights the potential molecular mechanisms underlying how SARS-CoV-2 may interact with cancer, especially in those patients suffering long-term and chronic illness. However, until now there is no clear evidence that SARS-CoV-2 has a causative role in cancer pathobiology. 

Future plans include extending the network with novel sources of evidence and comparing the molecular web of interactions with other oncogenic viruses, such as papillomaviruses, Epstein-Barr virus and hepatitis C, to elucidate any shared mechanisms. This knowledge will enable the development of novel therapies to target coronaviruses. 

The impact of COVID-19 on cancer incidence, both direct and on the decline of cancer care, is still unknown and further research is needed to improve our understanding about the disease and optimize cancer detection and treatment.  


This project was led by Dr Pau Erola, Professor Tom Gaunt and Professor Richard Martin. For more details about EpiGraphDB and the Integrative Cancer Epidemiology Programme programme please visit:  

https://epigraphdb.org 

https://www.bristol.ac.uk/integrative-epidemiology/programmes/icep/  

COVID-19: Pandemics and ‘Infodemics’

JGI Seed Corn funded project 

Blog Post by Drs Luisa Zuccolo and Cheryl McQuire, Department of Population Health Sciences, Bristol Medical School, University of Bristol. 

The problem 

Soon after the World Health Organisation (WHO) declared COVID-19 a pandemic on March 11th 2020, the UN declared the start of an infodemic, highlighting the danger posed by the fast spreading of unchecked misinformation. Defined as an overabundance of information, including deliberate efforts to disseminate incorrect information, the COVID-19 infodemic has exacerbated public mistrust and jeopardised public health.  

Social media platforms remain a leading contributor to the rapid spread of COVID-19 misinformation. Despite urgent calls from the WHO to combat this, public health responses have been severely limited. In this project, we took steps to begin to understand and address this problem.  

We believe that it is imperative that public health researchers evolve and develop the skills and collaborations necessary to combat misinformation in the social media landscape. For this reason, in Autumn 2020 we extended our interest in public health messaging, usually around promoting healthy behaviours during pregnancy, to study COVID-19 misinformation on social media. 

We wanted to know:  

What is the nature, extent and reach of misinformation about face masks on Twitter during the COVID-19 pandemic? 

To answer this question we aimed to: 

  1. Upskill public health researchers in the data capture and analysis methods required for social media data research; 
  2. Work collaboratively with Research IT and Research Software Engineer colleagues to conduct a pilot study harnessing social media data to explore misinformation. 

The team 

Dr Cheryl McQuire got the project funded and off the ground. Dr Luisa Zuccolo led it through to completion. Dr Maria Sobczyk checked the data and analysed our preliminary dataResearch IT colleagues, led by Mr Mike Joneshelped to develop the search strategy and built a data pipeline to retrieve and store Twitter data using customised application programming interfaces (APIs) accessed through an academic Twitter accountResearch Software Engineering colleagues, led by Dr Christopher Woods, provided consultancy services and advised on the analysis plan and technical execution of the project. 

Cheryl McQuire, Luisa Zuccolo, Maria Sobcyzk, Mike Jones, Christopher Woods. (Left to Right)

Too much information?!

Initial testing of the Twitter API showed that keywords, such as ‘mask’ and ‘masks’, returned an unmanageable amount of data, and our queries would often crash due to an overload of Twitter servers (503-type errors). To address this, we sought to reduce the number of results, while maintaining a broad coverage of the first year of the pandemic (March 2020-April 2021).

Specifically, we:

I) Searched for hashtags rather than keywords, restricting to English language.

II) Requested original tweets only, omitting replies and retweets.

III)  Broke each month down into its individual days in our search queries to minimise the risk of overload.

IV) Developed Python scripts to query the Twitter API and process the results into a series of CSV files containing anonymised tweets, metadata and metrics about the tweets (no. of likes, retweets etc.), and details and metrics about the author (no. of followers etc.).

V) Merged data into a single CSV file with all the tweets for each calendar month after removing duplicates.

What did we find?

Our search strategy delivered over three million tweets. Just under half of these were filtered out by removing commercial URLs and undesired keywords, the remaining 1.7m tweets by ~700k users were analysed using standard and customized R scripts.

First, we used unsupervised methods to describe any and all Twitter activity picked up by our broad searches (whether classified as misinformation or not). The timeline of this activity revealed clear peaks around the UK-enforced mask mandates in June and September 2020.

We further described the entire corpus of tweets on face masks by mapping the network of its most common bigrams and performing sentiment analysis.


We then quantified the nature and extent of misinformation through topic modelling, and used simple counts of likes to estimate the reach of misinformation. We used semi-supervised methods including manual keyword searches to look for established types of misinformation such as face masks restricting oxygen supply. These revealed that the risk of bacterial/fungal infection was the most common type of misinformation, followed by restriction of oxygen supply, although the extent of misinformation on the risks of infection decreased as the pandemic unfolded.

Extent of misinformation (no tweets), according to its nature: 1- gas exchange/oxygen deprivation, 2- risk of bacterial/fungal infection, 3- ineffectiveness in reducing transmission, 4- poor learning outcomes in schools.


Relative to the volume of tweets including the hashtags relevant to face masks (~1.7m), our searches uncovered less than 3.5% unique tweets containing one of the four types of misinformation against mask usage.

A summary of the nature, extent and reach of misinformation on face masks on Twitter – results from manual keywords search (semi-supervised topic modelling).

A more in-depth analysis of the results attributed to the 4 main misinformation topics by the semi-supervised method revealed a number of potentially spurious topics. Refinements of these methods including iterative fine-tuning were beyond the scope of this pilot analysis.


Our initial exploration of Twitter data for public health messaging also revealed common pitfalls of mining Twitter data, including the need for a selective search strategy when using academic Twitter accounts, hashtag ‘hijacking’ meaning most tweets were irrelevant, imperfect Twitter language filters and ads often exploiting user mentions.

Next steps

We hope to secure further funding to follow-up this pilot project. By expanding our collaboration network, we aim to improve the way we tackle misinformation in the public health domain, ultimately increasing the impact of this work. If you’re interested in health messaging, misinformation and social media, we would love to hear from you – @Luisa_Zu and @cheryl_mcquire.