
We are pleased to announce that Samuel Baker (Research Associate, School of Economics) is the winner of the 2022 data exploration and visualisation competition, ‘a map with a view’, in association with the Ordnance Survey (OS). We would like to say a big thank you to everyone who participated in the competition, as well as the OS for providing the data.
The OS contains a wealth of data, which could have been used to make a multitude of different products. The OS themselves have utilised this data to make a website, such as the initiative to help people #GetOutside[1]. Whilst a fantastic idea, I thought it was a shame only a small part of their dataset was being used within this product. I used this as an inspiration for how I would, roughly, have made the same application but designed to fully utilise the wealth of materials the OS have to offer.
Therefore, given how the GetOutside website works, the application would have to be a web-app of sorts. Unfortunately, as someone who mostly makes packages and software in Python and C++, this was not something in my skills toolkit. However, as part of my broader research goal of making tens of thousands of pages of historical data accessible to researchers and the public, I had been experimenting with several backend web frameworks, mostly Ruby on Rails and Django. Now faced with an actual deadline, since I have been programming in python for nearly 5 years now, Django won out.
Learning beyond the basics of Django was manageable in the time frame, given my Python background. Django has a powerful relational database framework, which allows for data models to be constructed with relative ease. Still, working with a much larger set of data comes with significant challenges. Filtering down ‘big data’ into something meaningful is crucial to good data science, but also for this product. Providing a list of locations, you could visit is relatively meaningless if you don’t know where they are or how to get there. Displaying these locations on the map and having a way to get directions when selecting this location would solve this. There are existing solutions to this, but the next question was, how reliant was I going to be on external APIs? 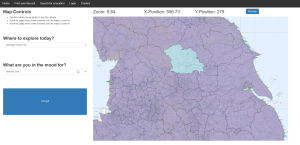
Various problems a web-app might have, like map visualisation for example, have dedicated solution providers, like ESRI or even the OS themselves. The OS has generous free API access for open data, but it will throttle if more than 100 people are making a request to a screen worth of tiles every ten seconds. ESRI, however, gives you a free base allowance, but once it’s gone, they will charge you per 1000 requests. It’s highly unlikely that this application would attract over 100 users a minute, especially at the beginning, but if someone was to make a company trying to provide this service, that’s your limit without paying. A solution that isn’t reliant on this will take more work to get running and optimise but gives the code base greater scalability going forward.
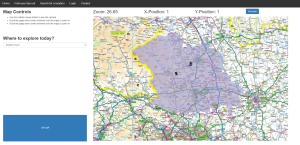
Avoiding using APIs was more of a learning experience than practical, but this was just a proof of concept, so the learning experience is part of the value of the project for me. Still, it resulted in a usable SVG map renderer, using no shortage of stack exchange [2] and my limited JavaScript knowledge. Whilst functional, it’s page load is heavy, which conflicts with Google’s research that found 53% of mobile page loads are abandoned if it takes over 3 seconds [3]. The solution is likely to use a combination of AJAX calls via jquery and the Django REST framework to start lazily loading smaller resolution images, and then improve them as the zoom level increases for raster images still in the viewport. Whilst I have a better idea of this now, this was beyond what I knew and could achieve for this project at the time.
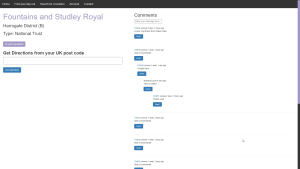 The result is a functional, although not particularly optimised solution, for exploring the 100,000’s of data points within OS Open Greenspace [4]. As an extension, I also generalised the database loader to allow for external open-source locations, such as from the National Trust [5] of English Heritage [6], to also be explored. Users can search for locations by name or narrow down what type of location and where it is, by using place location filters and the OS Boundary data [7]. Once they find a location, they can also get directions from their own address via linking to google maps. The final addition was adding some basic social media type functions, such comments and favourites, to make having a user account mean something, rather than just an authentication system for the sake of having one.
If I was to start this again, I would certainly do things slightly differently, but as you gain more experience, that’s usually the way of things. This has certainly been an interesting experiment, which will certainly help my own research aims. If possible, I may further this product further into an actual release, to try to make it a deliverable, but given other work commitments that’s not too likely in the immediate future. If you, for whatever reason, want to do that, then 100% of the code I have written is open source and on GitHub [8], and can be used however you want. If you’re brand new to Django, or just want to play around, there is also a YouTube video I made on ‘how’ to build it here [9].
[1]: https://getoutside.ordnancesurvey.co.uk
[2]: https://stackoverflow.com/questions/52576376/how-to-zoom-in-on-a-complex-svg-structure
[4]: https://osdatahub.os.uk/downloads/open/OpenGreenspace
[5]: https://open-data-national-trust.hub.arcgis.com/
[6]: https://historicengland.org.uk/listing/the-list/data-downloads/
[7]: https://osdatahub.os.uk/downloads/open/BoundaryLine
[8]: https://github.com/sbaker-dev/ToTheGreatOutDoors
[9]: https://www.youtube.com/watch?v=XnjFhzfCdsE