
Gaia Sky – Winner 2018
Gaia is a space telescope developed and operated by the European Space Agency. Launched in December 2013, its five-year mission is to make extremely careful measurements of the positions and brightnesses of more than a billion stars in the Milky Way and beyond. The positional accuracy provided by this amazing piece of engineering corresponds to distinguishing objects separated by the diameter of a coin at the distance of the moon, supported by instruments operating with nanometer-level precision, and the map of the galaxy it generates will underpin much astronomical research for decades to come.
Gaia orbits the Sun about 150 million km from the Earth, scanning the sky according to a carefully chosen pattern, and sends back information about each object it observes. Converting this raw data to a form that is usable by working astronomers, principally a per-star catalogue of positions, motions, brightnesses and associated quantities is a highly complex task, requiring the collaboration of hundreds of scientists from around Europe. An unusual feature of this mission is that the project members preparing the data are prohibited from making scientific use of it, and in most cases from accessing it at all, until the point of “Data Release”, when the science-ready catalogues are made public to all scientists everywhere without restriction. The recent second data release (Gaia DR2) at 12:00 CEST on 25 April 2018, and representing 22 months of observations, was therefore an event eagerly anticipated by astronomers around the world, and papers based on it have been appearing at the rate of several per day since then.
The images submitted to the JGI Beauty of Data competition are high-level overviews of the Gaia DR2 catalogue. They show an Aitoff projection of the whole sky, with the disc of the Milky Way running horizontally along the “equator”. You can click on these images to see much better resolution; each of the 3 million pixels aggregates observations of, on average, several hundred stars.
The first image represents the number of times that Gaia has observed each part of the sky so far, in some regions as few as 2, in others as many as 100. The beautiful loops and whorls are a consequence of scanning law.

The second image shows a measure of the averaged redness of the observed stars in each direction; dust along the line of sight has a reddening effect, so the darker regions in most cases indicate clouds of interstellar dust between us and the distant stars.
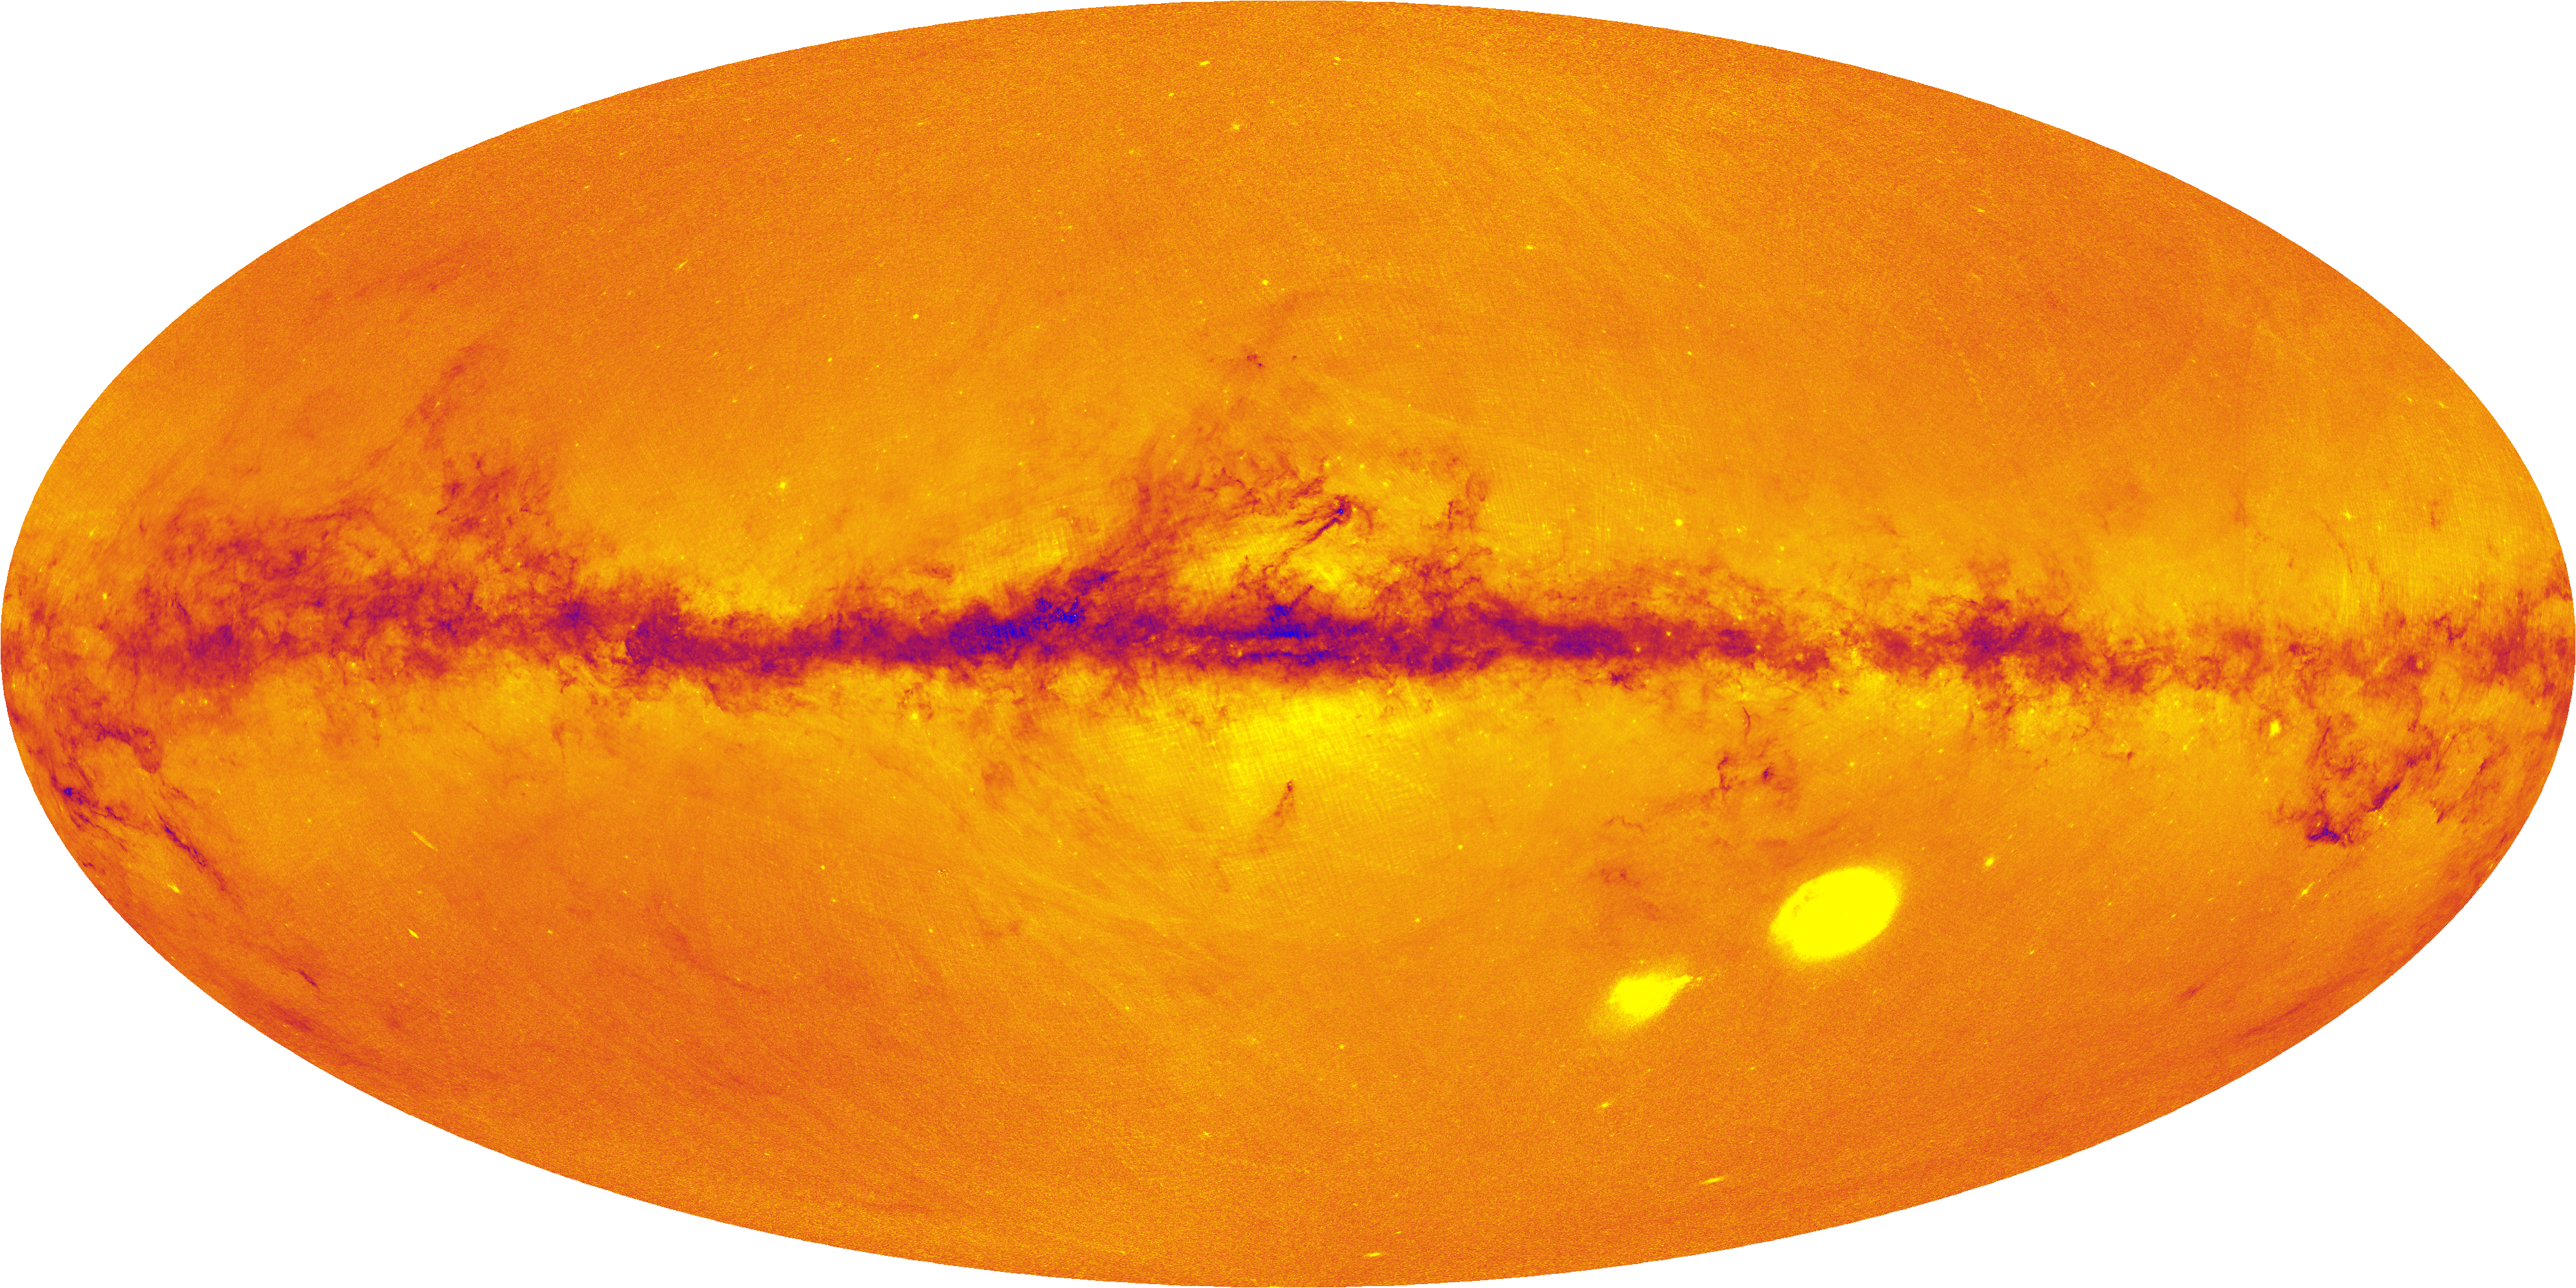
The third image is a density map, with the brightest regions indicating where most stars are visible. The most densely populated part is clearly the galactic plane, especially near its center, though the dust clouds mentioned above obscure our view in some places. The two blobs to the lower right are the Large and Small Magellanic Clouds, two of our closest galactic neighbours. If you look carefully you can also see stripes and arcs that betray the scanning pattern depicted in the top image.

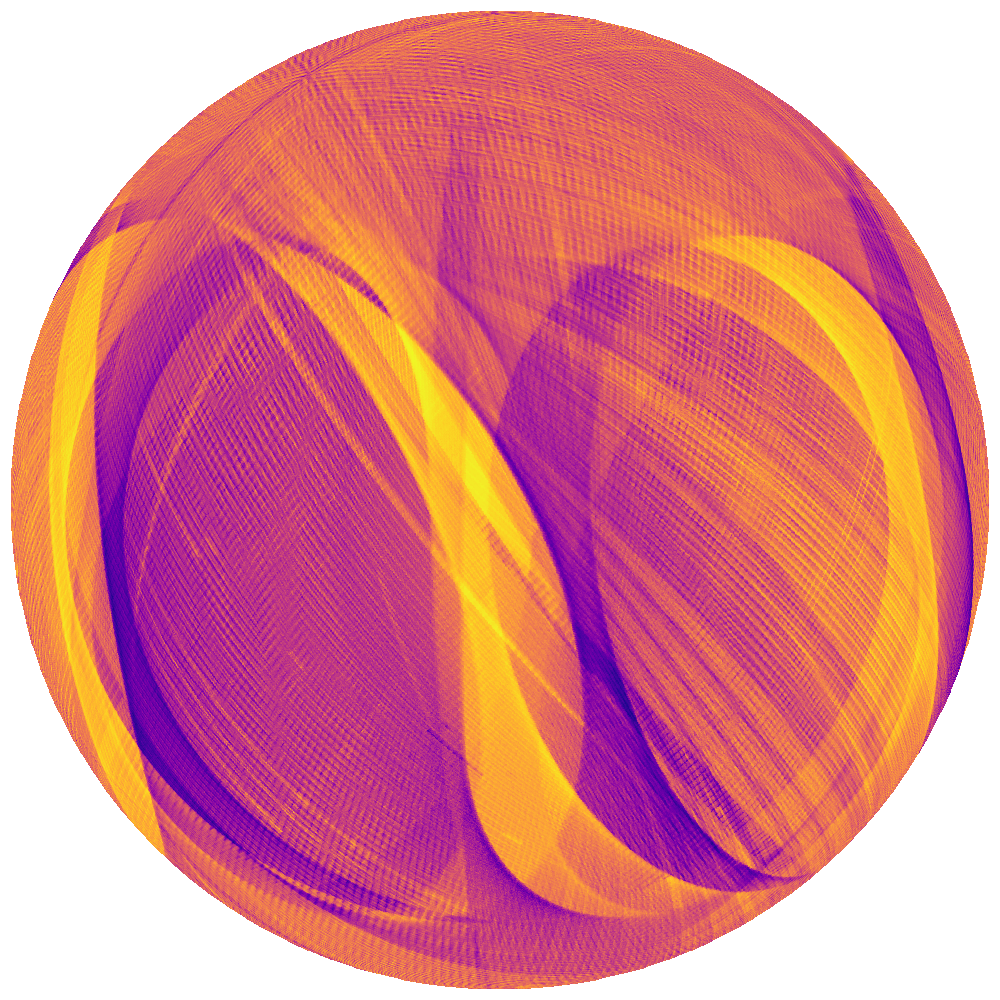
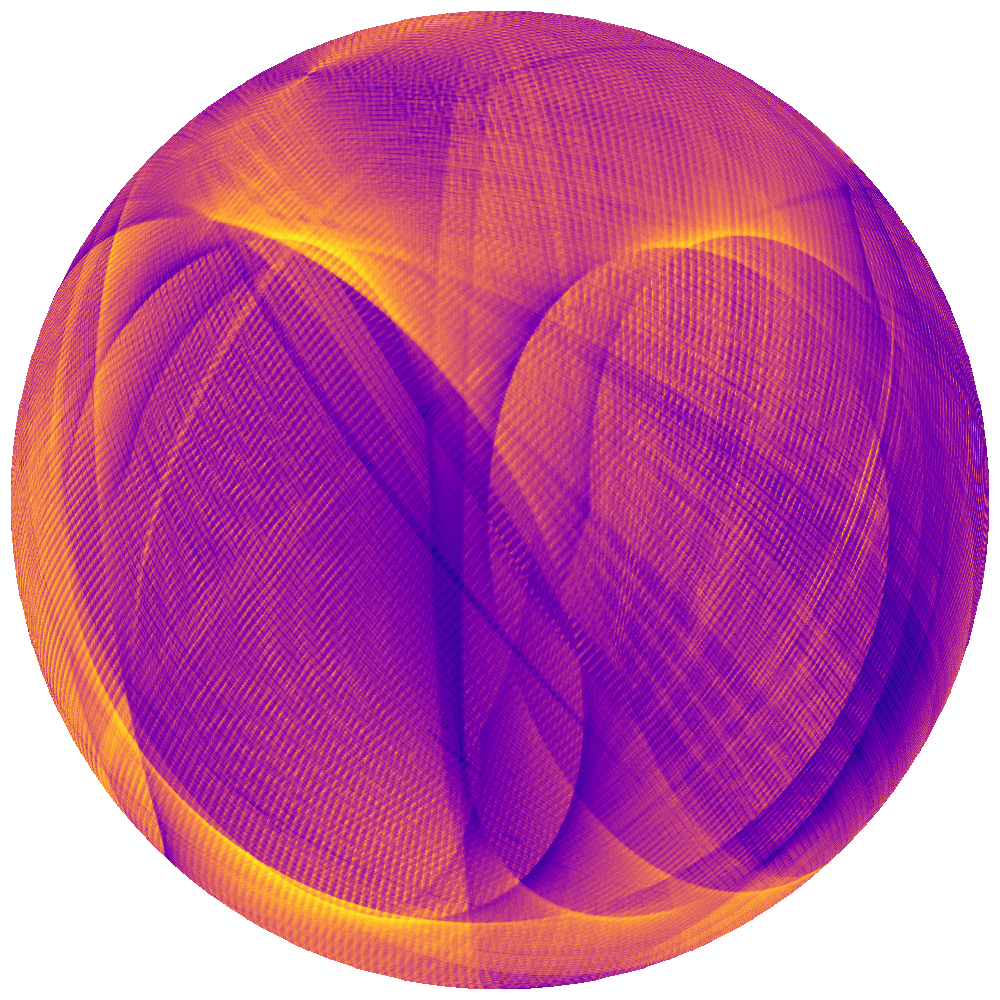
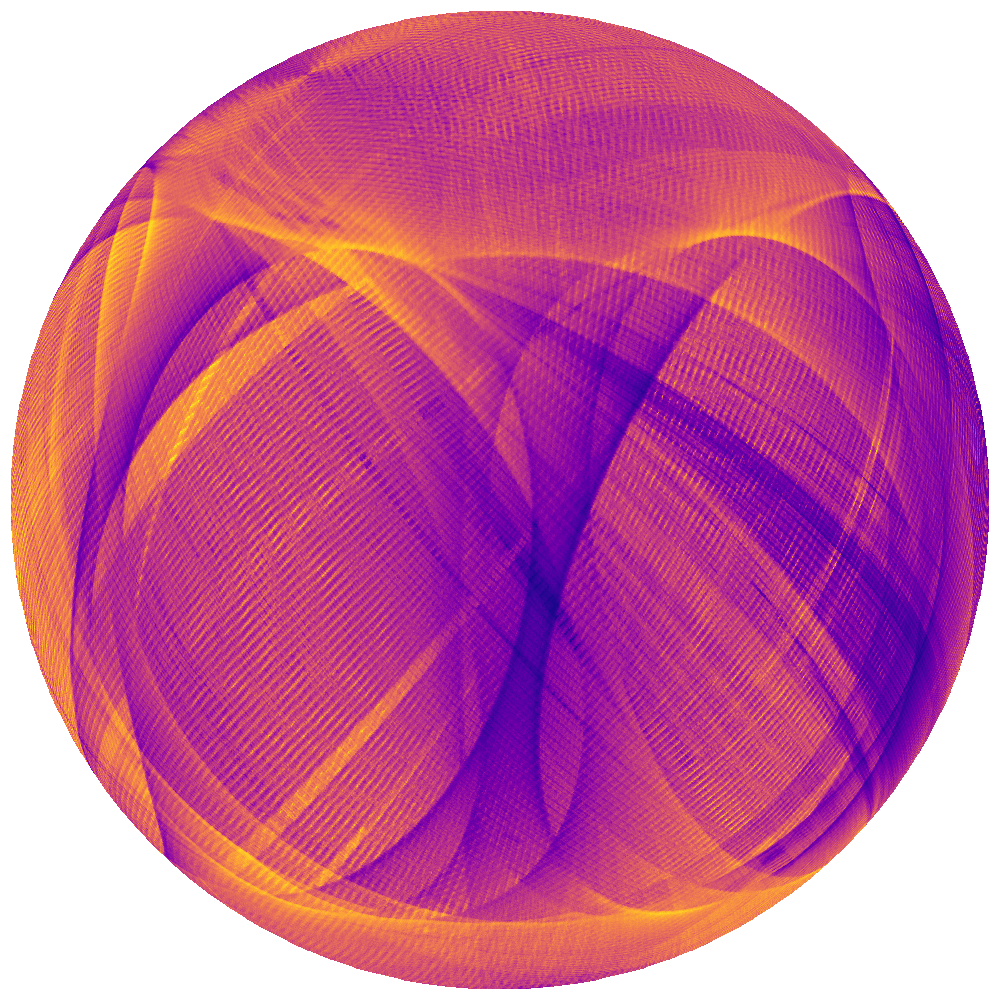
Some bonus images are shown below, depicting correlations between the measurements of position and motion by location on the sky. These quantities do not in themselves have astronomical significance, but they need to be understood when making detailed use of the data. A different sky projection has been used in this case.

All these images were generated from 0.8 Tb of catalogue data downloaded from ESA, using the TOPCAT/STILTS astronomical analysis software that has been developed in Bristol since 2003. These packages offer capabilities not available in other software to explore and analyse large tabular data sets interactively or in batch mode, and have been important tools both for the project experts in preparing the science-ready Gaia source catalogue, and for astronomers worldwide in mining that data to understand what it can tell us about the Universe in which we live.
Two more data releases are planned before the end of the Gaia mission.
Acknowledgement: This work has made use of data from the European Space Agency (ESA) mission Gaia (https://www.cosmos.esa.int), processed by the Gaia Data Processing and Analysis Consortium (DPAC https://www.cosmos.esa.int/web/gaia/dpac/consortium). Funding for the DPAC has been provided by national institutions, in particular the institutions participating in the Gaia Multilateral Agreement. Work on TOPCAT/STILTS has been supported by a number of funding agencies, most importantly the UK Science and Technology Facilities Council.
Blog written by Dr Mark Taylor, Research Fellow, School of Physics. m.b.taylor@bristol.ac.uk