JGI Seed Corn Funding Project Blog 2021: Lucy Biddle

Can sharing app data facilitate communication between young people and their mental health practitioner?

Bridget Ellis, Lucy Biddle, Helen Bould, Jon Bird

Mental health problems are increasing among young people, who have the highest prevalence of mental health problems among all age groups [1]. Despite the adverse outcomes that result from this, young people access mental health services at a lesser rate than other age groups [3], with barriers including communication, poor mental health literacy, embarrassment, fear of stigma and confidentiality concerns.

Research illustrates that digital peer support can help people with mental health difficulties [2] and the increased availability of mobile technologies is now being harnessed to deliver mental health support.

Our project was a collaboration with the company that created the award winning, NHS-endorsed young person’s mental health app, ‘Tellmi’ (www.Tellmi.help).  The app is a fully moderated peer support environment, where young people anonymously share ‘tweet’ style posts about their emotional and mental health difficulties. A holistic dataset builds up for each individual which could have potential clinical value if shared with a healthcare practitioner. For example, the posts can be tagged for content, rated for severity, displayed longitudinally and presented in a shareable summary document.

Previous feasibility survey and interview data investigated the views of young people who used the Tellmi app, and Child and Adolescent mental health services (CAMHS) clinicians about the acceptability and utility of sharing such a summary document during mental health consultations as a means of enhancing the clinical exchange. Our current study had two aims: i) to carry out in-depth thematic analysis of this previously collected data; and ii)  to form a multidisciplinary working group and convene a one-day workshop to present and discuss our findings as preparation for a full-scale research proposal.

We conducted thematic analysis on interviews with five young people and four healthcare practitioners, and 120 survey responses from users of Tellmi.

“So I think finding the words and putting them on Tellmi makes it easier to be able to say them to someone who is in front of you”

A theme was identified surrounding communication and how a summary document could be utilised to facilitate this between young people and healthcare practitioners. A concern raised by young people was that the way they communicate varies upon the audience they are communicating with, meaning a summary of the posts which they intended to be seen by peers may contain information they may not usually present to a clinician. Young people appear to value the written communication of Tellmi and were enthusiastic about how this could help to provide a focus and inform clinical sessions. For young people who struggle when trying to communicate their levels of distress with a clinician, this could be overcome through making it possible to share their experiences through their Tellmi posts. Additionally, providing a written account of how young people have been feeling may help to bridge a gap between the more honest and open information that is disclosed anonymously and that that is disclosed face-to-face with a clinician. However, young people did raise concerns about how this written information could be misconstrued or misinterpreted.

“If I feel comfortable with them then I’ll be more likely to share but if I don’t feel comfortable then I would not share”

We found that trust would play a key role in the process of sharing. This was not only trust between a young person and their clinician but also trust between a young person and Tellmi and how sharing could change how young people engaged with the app going forward. Clinicians also raised questions about trusting the Tellmi app, in particular how successfully an algorithm can identify risk or how the data being shared may be monetised.

“Tellmi posts do tend to be quite personal and honest and open because you expect to be talking to someone who isn’t really there so you can say whatever you like and there’s no judgement”

Young people seem to really value Tellmi as a safe space. This safety appeared particularly facilitated by the anonymity it provides. Young people were concerned about how their data may be handled if it was no longer anonymous and being shared with clinicians.

We also found practicalities surrounding sharing that would need to be addressed. For example, young people required control over their data and how it is used and shared. The potential of young people censoring the information they present to their clinician was also discussed. Additionally, the impact that revisiting old posts may have on young people was considered. Factors specific to clinicians could also impact sharing, with time being a concern for both clinician and young people.

“I think it’s [sharing a Tellmi summary] a great idea but the young people would need to have complete control of the information that is included to avoid endangering young people”
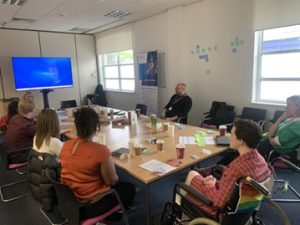
Workshop

Our multidisciplinary working group consisted of three researchers from computer science and health sciences, two child and adolescent psychiatrists, representatives from Tellmi, and two young people with lived experience of mental health difficulties. We presented our findings from the thematic analysis then used discussion sessions and group work to consider implications for the design of future research. We discussed how data sharing is likely to be most beneficial; how acceptability can be enhanced for young people and clinicians; stakeholders’ evaluations of the dummy data summary document of Tellmi posts, including methods of data visualisation; and potential barriers to data sharing in practice.

Discussion of the design for a user study of Tellmi data-sharing in practice identified this would involve varied stakeholders, including Tellmi users, researchers and clinicians. It was noted that recruitment could bring challenges and discussion sought to identify the most appropriate pathways for recruiting clinicians and young people in paired groups so that both perspectives can be captured for each case of data sharing. If recruiting through clinicians, it was noted that young people may not be Tellmi users or have enough data to produce a summary document. A suggestion for overcoming this was to ask young people to engage with Tellmi while on a waiting list. However, one of the lived experience advisors highlighted a challenge: I think another issue with recruiting people through NHS is that no matter how good an app is, if you are young person on a waiting list and a clinician says, Use this app, its like, No, I want you to help me and why am I going to use an app?. Alternatively, we discussed recruiting through the Tellmi platform and young people approaching their clinicians to get involved. However again, there would be challenges with this approach such as obtaining ethical approvals and clinical ‘buy in’ where relevant young people could be based all over the country.

We also discussed the practicalities of sharing and how a study procedure would be designed, focusing this discussion around the implications for design highlighted in our thematic analysis. This encompassed details determining how the process of sharing would actually take place. For example, we considered whether the summary would be shared as a physical document or an electronic copy, and whether this should be given to the young person to present to their clinician or be sent directly to the clinician. When to share is also a key consideration, our data showing young people have varied views around this and whether sharing should be repeated, and if so, at what frequency. Additionally, methods of improving and encouraging sharing were discussed, as well as the overall design of a summary document and how this could be altered to ensure inclusivity for special educational needs.

Key to designing a research study were methods of evaluation and establishing outcome measures. Young people and clinicians flagged a range of potential outcomes. These included completing clinical tasks such as goal setting, and how successful a young person may consider a session “something else to measure would be how the young person feels coming out of the appointment. Has it empowered them or let them take control of their healthcare”. The view of the young person was considered key in determining how outcome would be measured “it’s just making me think what is the actual point of sharing the data again? I guess that depends on the young person”.

The workshop provided a space for exciting discussion with input from stakeholders from different backgrounds. While we hoped it would allow elements of co-design to inform development of a data sharing document and research plans to evaluate this, challenges were raised which suggest further development work may be necessary before the process of sharing can be evaluated. The ideas and issues raised at our workshop will be explored through our continued collaboration with Tellmi.

The workshop was incredibly insightful. It provided us the opportunity to discuss the findings of the study with a diverse group of experts including academics, clinicians and young people with lived experiences of poor mental health. It has helped us to completely rethink how to approach the problem and we look forward to continuing to work with the Bristol team.” Kerstyn Comley, Tellmi Co-CEO

JGI Seed Corn Funding Project Blog 2021: Dr Josh Hoole

Exploiting Data to Support UK Search and Rescue

Dr Josh Hoole, Dr Oliver Andrews, Dr Steve Bullock

Introduction

Various UK organisations provide 24/7 Search and Rescue (SAR) capability year-round across land, sea and air. Data analytics provides a key route to supporting SAR operations and aerospace system design in the future.

Aims of the Project

The aim of this project was to explore what data is available to capture the variability present in SAR operations (including mission characteristics and weather) to help support the future design of aerial systems to support SAR. This aim was to be achieved using the following objectives:

Engagement with search and rescue organisations to establish:

  • Availability of data for characterising SAR mission profiles
  • Perceptions on developing Unmanned Aerial Vehicles (UAVs or ‘drones’) to support SAR

Data fusion across asset tracking data to characterise SAR mission profiles:

  • Exploitation of aircraft and vessel trajectories
  • Combining mission profiles with meteorological data

This project therefore lay at the exciting and valuable intersection between data science, aerospace systems, weather and climate analysis and SAR.

Results

To date on the project, the following activities have been performed supported by the Seedcorn Funding:

Data Workshop with the Royal National Lifeboat Institution (RNLI)

A one-day workshop was held with the RNLI Data team at the RNLI College in Poole. Within this workshop, areas of interest and ideas were shared spanning the exploitation of data for mission analysis, future planning and the use of computer vision to support lifesaving activities. The University of Bristol team were simply amazed at the large amount of data-driven work performed by the RNLI and look forward to establishing stronger links between the RNLI and research institutions in the future (see contact details below).

There was also a tour of the RNLI’s training and lifeboat manufacturing facilities as part of the workshop to provide context to the RNLI’s activities. The Bristol team were overwhelmed by the vast and diverse capabilities present in a single location and thoroughly recommend a tour of the RNLI College and All-weather Lifeboat Centre.

RNLI Workshop Participants at the RNLI memorial


RNLI All-weather Lifeboat Centre for Lifeboat Manufacture and Maintenance

Initial Assessment of Vessel Tracking Data

Maritime vessels are equipped with real-time tracking capability via Automatic Identification System (AIS) installations. Historic AIS data provides vessel trajectories which can be post-processed to characterise the mission performed. Building on prior work in the literature, an initial investigation into processing the AIS trajectories of RNLI lifeboats has been performed using data sourced from MarineTraffic. Using simple algorithms, AIS trajectories can be processed to identify the occurrence of lifeboat search manoeuvres and generate characteristics regarding the search operation (e.g. search time, search area, etc.). It is intended that such characteristics can be used in the future to support the post-mission reporting performed by the RNLI.

Identification and characterisation of search areas within lifeboat trajectories (data source: MarineTraffic)

Data Fusion to Enhance SAR Helicopter Tracking Data

A large number of aerospace vehicles are also equipped with real-time tracking capability via Automatic Dependent Surveillance-Broadcast (ADS-B) equipment. However, as a line-of-sight system, ADS-B derived trajectories are often lacking in the regions where SAR operations take place, such as at low altitude, close to obstructions or out at sea. SAR helicopters are also equipped with AIS equipment, permitting ADS-B and AIS data sources to be fused to greatly increase the coverage of SAR helicopter trajectories. The ADS-B/AIS fused trajectories can then be further processed to generate mission characteristics as for the maritime vessel trajectories.

Fusion of ADS-B and AIS trajectories for SAR Helicopters (data sources: Opensky Network, MarineTraffic)

Future Plans

Exploitation of Meteorological Data Products

Following completion of the SAR mission characterisation via AIS and ADS-B data sources, the project will intend to couple the trajectories to meteorological data products to fully characterise the SAR operational environment. This level of data fusion could support automated post-mission reporting, draw correlations between the search characteristics and operating environment, as well as support future planning with respect to the impacts of climate change on UK SAR operations.

Engage further with Inland SAR Organisations (PhD projects)

So far, the project has focused on maritime SAR. Future work will engage with inland SAR organisations to a greater extent and initial links have been formed with the relevant organisations. Dr Steve Bullock has successfully secured funding for two PhD students in the area of SAR planning for UAVs and these project will aim to leverage the expertise from the SAR connections made during this project.

Future SAR Data Research Partnerships

The workshop with the RNLI highlighted a significant number of data-centric avenues that could be pursued within future research projects, including aspects of machine learning, computer vision, weather and climate, along with mission analysis. A future workshop is planned, and researchers from across the data community at the University of Bristol are encouraged to participate, so please get in touch via the contact details below. The University of Bristol team are also very keen to explore collaborative partnerships within this area with other research institutions (GW4 and beyond) and SAR organisations. Please send any expressions of interest regarding future opportunities to the contact details below.

Contact Details Dr Josh Hoole, Department of Aerospace Engineering, University of Bristol, josh.hoole@bristol.ac.uk

Medfluencers: how medical experts influence discourse about practices against COVID-19 on Twitter

Introduction

This project aims to investigate the role of medical experts on Twitter in influencing public health discourse and practice in the fight against COVID-19.

Aims of the Project

The project focuses on medical experts as the driving force of Network of Practices (NoPs) on social media and investigates the influence of these networks on public health discourse and practice in the fight against COVID-19. NoPs are networks of people who share practices and mobilise knowledge on a large scale thanks to digital technologies. We have chosen Twitter as a focus of our analysis since it is an open platform widely used by UK and international medical experts to reach out to the public. A key methodological challenge that this project seeks to address is to extend existing text analytics and visual network analysis methods to identify latent topics that are representative of practices and construct multimodal networks that include topics/practices and actors as nodes and Twitter affordances as edges of the network (e.g. retweets, @metions). To address this challenge, the aims of this project are:

  1. Build a machine learning classifier of tweets that mention relevant practices in the fight against COVID-19.
  2. Build a machine learning classifier of authors of tweets, which can distinguish between medical experts and other key actors (e.g. public health organisations, journalists).

Results

1. Data Collection

We used the report from Onalytica to identify the top-100 influential medical experts on Twitter.   After receiving academic access to Twitter API, we collected a total of 424,629 tweets from the official accounts of these medical experts with the R package academictwitteR from 01 December 2020 to 02 February 2022.

2. Build a machine learning classifier for relevant practices

After cleaning the data set, we randomly selected a sample of 1,200 tweets, which was then manually coded as either “relevant” or “non-relevant” by two independent coders and employed to train the Machine Learning classifier. By relevant we mean representative of relevant practices in the fight against COVID-19 (e.g., wearing a mask, getting a vaccine). After training and testing a series of algorithms (support vector classifier, random forest, logistic regression and naïve Bayes), a support vector classifier (SVC) gave the best classification results with 0.907 accuracy. To create the inputs to the classifier, we used a sentence transformer to convert each tweet to feature vector (a sentence embedding) that aims to represent the semantics of the tweet (https://www.sbert.net/). We compared this to a feature vector representing the number of occurrences of individual words in the tweet, achieving lower performance of 0.873 with a random forest classifier. For reference, the baseline accuracy when labelling all classes as relevant is 0.57, showing that the classifier can learn a lot from simple word features. The performance of SVC, random forest and logistic regression was similar throughout our experiments, suggesting that the choice of classifier itself is less important than choosing suitable features to represent each tweet. We applied the chosen SVC + sentence embeddings classifier to the remaining sample of tweets, resulting in 235,320 tweets that were classified as representative of relevant practices.

3. Topic modelling

We employed a topic modelling analysis to gain a better understanding of the types of practices that were discussed by the medical experts. After testing a number of indexes, we found 20 latent topics, were present in our data. We therefore employed a LDA (Latent Dirichlet Allocation) topic model analysis with 20 topics (Figure 1).

Figure 1. Output of Topic Modelling Analysis with 20 Topics

We selected 9 topics related to significant practices linked to the fight against Covid-19:

  • Topic 1 is about vaccines
  • Topics 2 and 16 are about global health policy/practices
  • Topic 6 is about prevention of long covid in children
  • Topic 9 is about immunity (either natural or vaccine-induced) against variants, hence related to COVID-19 public health measures or practices
  • Topic 13 is about reporting of COVID cases and therefore linked to effectiveness of public health measures or practices
  • Topic 18 is about masks (in schools)
  • Topic 19 is about testing
  • Topic 20 is not about a “public health” practice but a scientific practice about sequencing
4. Build a machine learning classifer of authors of tweets

One hundred twitter bios of medical experts were not enough to build the machine learning classifier. Therefore, we upsized our sample by including the bio descriptions of accounts that medical experts followed on Twitter. This strategy allowed us to include bios of users who were not medical experts and therefore differentiate between medical and non-medical “experts” or influencers. We collected the “following” accounts with the R package “twitteR” resulting into a total of 315,589 bios. We randomly selected a smaller sample for the manual coding of these bios (2,000). Following an inductive approach, two independent coders manually coded the bios into labels that classified individuals by their job occupation/profession and organizations by their sector or mission. The label “non classifiable” was used for bios that could not be classified in any professional or organizational category. This resulted into a total of 188 labels which were then aggregated into higher-level categories resulting into a final list of 49 labels.

Future plans for the project

We will use the coded sample of Twitter bios to train a Machine Learning classifier of authors of tweets. We will apply for further funding to improve our methodology and extend the scope of our project, for example, by including more medical conditions, non-English speaking countries, and other platforms in addition to Twitter. We will improve the methodology by identifying experts from a sample of collected Tweets by relevant topics representative of practices and sample and classify authors’ bios from this sample. This will allow us to have a more representative sample of individuals and organizational entities that are active in the public health discourse related to COVID-19 and other medical conditions on Twitter. We will classify practices and then map classified practices and authors onto a network to conduct a network analysis of how medical influencers affect discourse about public health practices on Twitter.

Contact details

For further information or to collaborate on this project, please contact Dr Roberta Bernardi (email: roberta.bernardi@bristol.ac.uk)

Mapping the linguistic topography of Sophocles’ plays: what Natural Language Processing can teach us about Sophoclean drama

Benjamin Folit-Weinberg, A.G. Leventis Postdoctoral Research Fellow (Institute for Greece, Rome, and the Classical Tradition & Department of Classics & Ancient History, University of Bristol) and Justus Schollmeyer, Data Scientist & Programmer

Scholars have long recognized that Sophocles, the great 5th Century B.C.E. tragedian, repeats thematically important words in his plays and that studying these repetitions can offer fundamental insights into his work. At present, however, identifying these repetitions is time-consuming and unsystematic, and the significance of specific repetitions is not always clear. Our project applies Natural Language Processing (NLP) and data visualization techniques to help scholars of Sophocles both identify linguistic patterns more efficiently and rigorously and interpret the significance of these patterns more insightfully.

Seed Corn funding provided by the Jean Golding Institute allowed us to create a feasibility prototype for an NLP and data visualization tool with several functions. The first function is heuristic and identifies the words or word families that appear most frequently in each of the seven fully extant plays of Sophocles. The second function is analytical and calculates how frequently a given word or word family is used in a specific play by Sophocles compared to the remaining six plays. The third function is hermeneutic and depicts the distribution of selected words within a specific play (see diagram below); the chart will ultimately include various overlays that demarcate units of the play and articulate relationships between uses of key words.

The successful development of this feasibility prototype has enabled us to apply for further funding to develop our tool; our goal is to make this available as a common good to anyone with an internet connection, regardless of their institutional affiliation or programming literacy. We are also exploring the possibility of scaling up our tool to address the entire 5th Century Athenian dramatic corpus and other corpora of texts from Greco-Roman antiquity.

For further information, please contact b.folit-weinberg@bristol.ac.uk

Prototype map of use of selected words in the tel- word family in Sophocles’ Oedipus at Colonus

JGI Seed Corn Funding Project Blog 2021: Emily Blackwell

Transferring early disease detection classifiers for wearables on companion animals

Axel Montout, Andrew Dowsey, Tilo Burghardt, Ranjeet Bhamber, Melanie Hezzell and Emily Blackwell

Introduction

Sensor-based health monitoring has been growing in popularity as it can provide insight into the wearer’s health in a practical and inexpensive way. Accelerometer-based sensors are a popular choice and have used been for various applications, ranging from human health to livestock monitoring.

Figure 1: Kiki wearing accelerometry device

Aim of the Project

This project aims to predict early signs of degenerative joint disease (DJD) in indoor cats with the use of accelerometers and machine learning techniques.

Methodology and Results

Dataset

Data points originating from a study investigating DJD in cats were used in this project1. Fifty-five pet cats were equipped with a wearable sensor that collected accelerometery data over a continuous 12-day period.

The Raw data comprised of 57 MS Excel spreadsheets containing the sensor data, along with a metadata spreadsheet, which described the age and joint health of each individual cat, and included an owner-generated mobility score (evaluated by the owner in a series of questions asking them to report changes in the mobility of their cat).

Out of the 57 sensors, five were set up to measure activity counts every millisecond, while the rest collected activity counts every second. For this project, all the activity data were resampled to the second resolution (i.e. each count contains the sum of activity counts within each second) if it was not already at that resolution.

Figure 1. Histogram of Ages. Figure 2. Histogram of Mobility score.

Samples

Using supervised machine learning (SVM)2 requires the building of samples which are composed of an array of features and a ground truth value, which is the value we want to predict. In this case, we decided to solely use activity counts as features and the health score as ground truth.

Accelerometry data for three of the cats were excluded from further analysis, as their respective sensors were calibrated differently compared to the rest of the cats. Although postprocessing approaches could tackle such an issue, this was done as a safeguard to avoid biasing the analysis.

Given the limited number of cats (55), we decided to build multiple samples out of each individual cat. We hypothesised that the effect of degenerative joint disease would reflect more in the activity of a cat when it is performing higher activity behaviour such as jumping, quick running etc. For that reason, we created samples by looking for peaks of activity in each cat trace and selecting a fixed amount of activity data before and after the peak occurred, effectively building a window around the peaks. We fixed the window length to 4 minutes, or 240 seconds, and selected the top 0.001% of peaks, based on the activity count value. With this approach, we were able to generate 10 peaks per cat, giving a total of 550 samples.

Pre-processing

Before feeding in the dataset of peaks, the data was pre-processed (features) to optimise the predictive power of the machine learning classifier. In order to establish which pipeline was optimal, several different pre-processing pipelines were used. Here, only our ‘Baseline’ pre-processing pipeline will be discussed. We initially applied quotient normalisation to the array of activity of the sample, followed by standard scaling.

Quotient Normalisation

This prepossessing step aims to normalise the amplitude of the activity in the samples.

Standard Scaling

This standardizes features by removing the mean and scaling to unit variance. The standard score of a sample x is calculated as: z = (x – u) / s

Figure 5. Visualisation of the average of all healthy and unhealthy peaks. The left column shows the sample activity time series data while the element wise continuous wavelet transform3 is displayed on the right.

Data Augmentation

The initial dataset was augmented (increasing the number of samples) by building permutations of peaks from the initial 550 sample dataset. Permutations of 2 and 3 peaks were built, creating datasets containing 4680 samples (2250 healthy and 2430 unhealthy) and 37440 samples (18000 healthy and 19440 unhealthy) respectively.

Machine Learning

An SVM classifier (RBF kernel) was trained with the datasets described above. To evaluate the prediction performance, we used the leave one out cross-validation method, where we trained the model with all the samples in the dataset, apart from the sample from one cat, which was used for testing. This was done so that all 50 cats were tested against the rest. All samples were pre-processed by applying quotient normalisation and standard scaling before training the SVM.

Results

We used the area under the curve (AUC) of the receiver operating characteristic (ROC) curve to evaluate performances. For the 1, 2 and 3-peaks dataset, a testing AUC of 57%, 65% and 69% were obtained respectively. Using more than three peaks did not improve the results.

Figure 6. ROC curve of an SVM classifier when training on the 1-peak dataset, the AUC is 57%. The purple curve shows the training AUC while the blue one shows the testing AUC.


Figure 7. ROC curve of an SVM classifier when training on the 2-peak dataset, the AUC is 65%. The purple curve shows the training AUC while the blue one shows the testing AUC.


Figure 8. ROC curve of an SVM classifier when training on the 3-peak dataset, the AUC is 69%. The purple curve shows the training AUC while the blue one shows the testing AUC.

Conclusion and Future Plans

Despite the limited amount of data available, a machine learning approach demonstrated promising results in the prediction of early joint disease in cats, with the help of our data augmentation approach. These results suggest that the data within small windows, centred around bursts of activity, contains enough information to discriminate a healthy cat from an unhealthy cat. Further work is currently ongoing to determine which part of the window of activity is most important for prediction. We hope that this will provide a novel insight into how the activity traces of cats with early joint disease differ from unaffected cats, when performing movements involving high activity.

Further Information

For further information about this study please contact Dr Emily Blackwell, Emily.blackwell@bristol.ac.uk

More details about the Bristol Cats Study are available here: http://www.bristol.ac.uk/vet-school/research/projects/cats/

Bibliography

1.MANIAKI, E, Risk factors, activity monitoring and quality of life assessment in cats with early degenerative joint disease. Msc thesis, University of Bristol (2020)

2.CORTES AND V. VAPNIK, Support vector network, Machine Learning, 20 (1995), pp. 273–297.

3.DAUBECHIES, J. LU, AND H.-T. WU, Synchrosqueezed wavelet transforms: An empirical mode decomposition-like tool, Applied and Computational Harmonic Analysis, 30 (2011), pp. 243–261