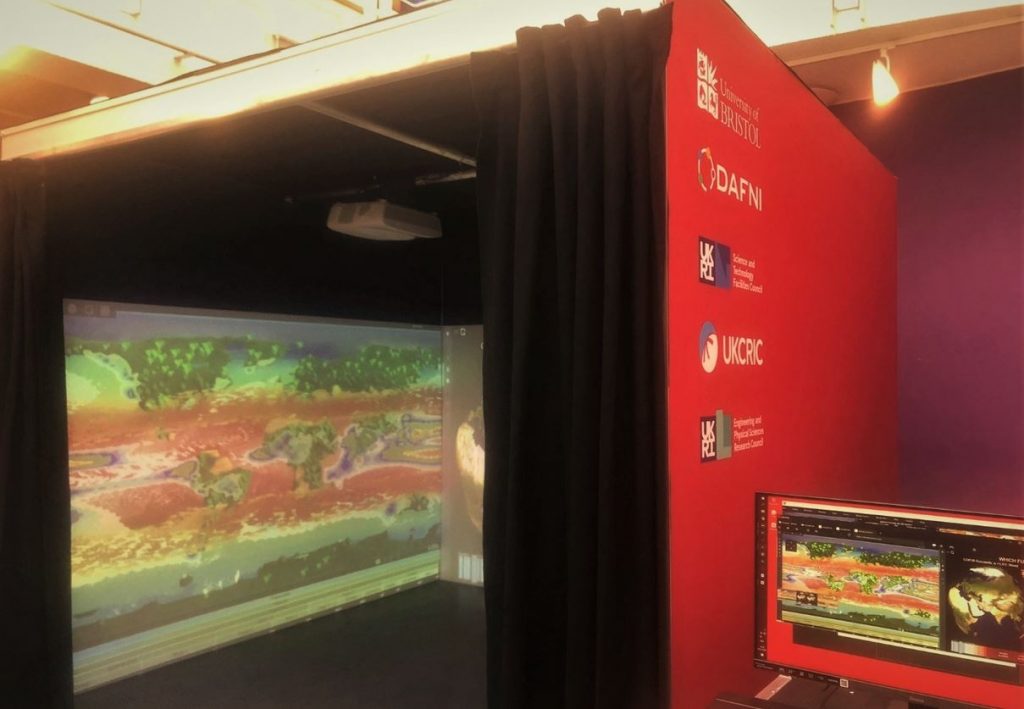
Join us at the Bristol Data & AI Showcase on Tuesday 7 June 2022, for a chance to play with and find out more about visualising past and future climate change with a new 3D visualisation tool. Look back to your birth year, your parents’ birth years, or even as far back as the dinosaurs!
Hear from the creators, Sebastian Steinig, School of Geographical Sciences (sebastian.steinig@bristol.ac.uk) and Tessa Alexander, Developer at the Research IT, in a short video about the project.
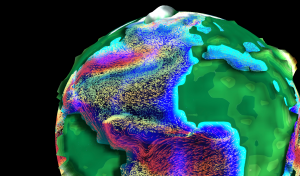
Sebastian notes that he hopes users will be able to “feel past and future climate change” to understand “how dynamic our Earth system was in the past”, but also to “see how alarming our current warming is in this context”.
Tessa notes that attendees of the Showcase may be interested in “moving the timeline back to when they were born” and “seeing how much the climate has changed within their own lifetime”.
Read more about the Climate Archive project blogpost and find out about previous JGI Seed Corn Funded Projects.