

In our new blog feature, Spotlight on data, the JGI interviews the owners of datasets available on the University of Bristol’s data.bris platform. We want to showcase the great research that goes on at the University and help bring people’s attention to datasets which could be reused in new and exciting ways.

In our first blog of the series, Natalie Thurlby, Data Scientist at the JGI, talks to Dr David Troy about open science and how quickly people drink lager with respect to the “Effect of glass markings on drinking rate in social alcohol drinkers” datasets, one and two.
Nat: Could you tell me about the research project behind the dataset?
David: The project was looking at the effect of glass markings on the speed of drinking alcoholic beverages. There were two studies involved in the project.
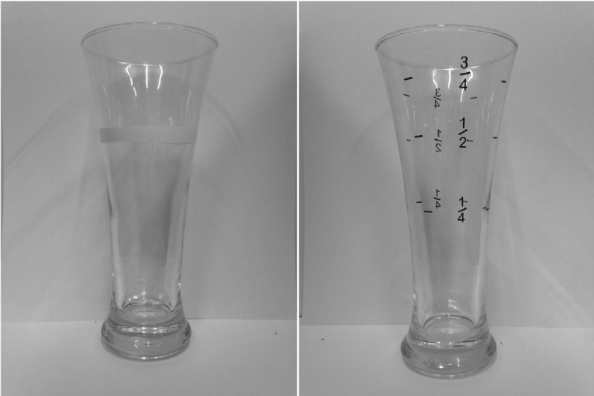
In the first study [relating to the first dataset], 160 people were recruited and half of them (80 people) received a curved glass with a marker (yellow tape) showing the midpoint in terms of volume, and the other half received the same glass without the marker. The hypothesis was that the people drinking from the glass with the marker would drink slower since they would be more aware of the speed that they were drinking. It turned out that there was no difference in drinking times between the two groups. Angela Attwood in partnership with Marcus Munafò designed the studies and I analysed it.
The second study (relating to the second dataset), black markings with numerical labels denoting the volume were placed at one quarter, one half, and three-quarter points. It was published in European Journal of Public Health. We found modest evidence for an effect with the new study design.
Nat: Asking the important questions here: what brand of lager did they drink?
David: In the first study, there were two strengths of lager, both cheap small bottles of Lidl beer. In the second study, I think it was Budweiser.
Nat: And what analysis did you do on the data?
David: We used linear regression in both studies. Total drinking time data were analysed using multiple linear regression including glass marking (unmarked, marked) and lager strength (low, standard) as predictor variables and an interaction term of glass marking and lager strength.
Nat: What were the particular challenges of this project and what was your favourite bit?
David: Interpreting the findings of study 2 was quite challenging because we had to interpret the results in quite a nuanced way. We had a p-value of 0.072, which is above 0.05, which most people talk about as the cut-off for being significant. I don’t believe in the dichotomy of significance and non-significance, but not everyone agrees with that. In the end, we said there was modest evidence for an effect, which doesn’t say “there’s nothing here”, we didn’t say “there’s great signal here”.
My favourite bit was probably testing the last participant because it was 160 people and took 2 or 3 months to test them all. Publishing the work and talking at conferences was also really nice of course.
Nat: Why did you decide to put the data in the repository?
David: It helps me be a better scientist. That’s probably the number one reason; if you know that your data is going to be accessible by everyone, then you’re going to make doubly and triply sure that your data is right and is labelled correctly and clearly.
If other people come across the paper and want to verify my findings, then other people can download my data, run their own analysis on it and see if they get the same results or if I’ve made any mistakes. That would be great! That’s what we’re trying to do in science, we’re trying to do experiments that are able to stand up under scrutiny. Open data helps us do that.
Another use is if someone was doing a meta-analysis of alcohol-related or glass-related studies, they could get to the base data and calculate whatever they needed from that.
Those are personal benefits, but a benefit for science is that it’s also easier to spot fraud if you have the base data, so if open data was the norm, labs under scrutiny wouldn’t be able to say they’d lost the file, etc..
Nat: I’m wondering if someone could use it to do a good data visualisation. Is there anything that you’d like to see?
David: I saw a good one (not of my data) of how much teenagers are drinking, displayed in pint glasses. You’d need some graphic design skills for that, which I don’t have. I bet people could come up with some cool stuff.
Nat: Do you have any tips for other people who’d like to put their data on data.bris?
David: If you want to make your data open access, make sure you ask your participants in advance. That didn’t happen with the first study, so people have restricted access to that dataset. When I put my data on data.bris, I put my data sheet in the .csv format so it can be opened in many different programmes. I do the same for the data dictionary which explains clearly what variables are in the data sheet. I briefly explain the study in a txt file and I’ve started putting the study protocol, information sheet and consent form in the repository as well. People can search for my name on the data.bris site and download the files to use as templates if they like.
Nat: How do you think the concept of open research will affect your field? Has it already made a difference?
David: It’s probably too soon to have a real impact on my field or any field, but I think it’s going to be the default way to do science from now on. Everyone should be publishing their journals in open access papers and pre-registering their protocols, especially if your work is publicly funded like mine was. The people who paid for my research should be able to read it.
I think open science is definitely going to make science more rigorous. You’re not going to be able to get away with some of the shenanigans that researchers got away with in the past, for example, Brian Wansink encouraging his students to re-analyse a dataset in lots of different ways in order to get a smaller p-value (i.e. HARKing and p-hacking).
Nat: How else did you make your research “open”?
David: Study 1’s protocol wasn’t preregistered. That study was designed before I started my PhD. I preregistered the protocol for Study 2 on the Open Science Framework and submitted it to an open access journal, as well. I do want to a registered report, I haven’t done that yet. And I haven’t published any syntax or code yet either. I felt like it was too simple for my PhD analysis, but in the spirit of transparency, I should probably have done that.
Nat: We can all improve our open research ways! What are you doing next?
David: I’ve just started a new role in population and health sciences, it’s a training role for two years to learn a lot of different new skills and I’m doing a couple of new things.
The main thing I’m doing at the moment is secondary data analysis on the ALSPAC dataset. I’m looking at risk-taking behaviours in young people measured at ages 12, 14, 16 and 18 and then we’re going to analyse the patterns of risk-taking behaviours as they get older. I’m hoping to do a registered report with this one – there are some journals that accept secondary data analysis.
Nat: I love the idea of registered reports! I hope they become widespread in more fields.
David: Yeah, they are the gold standard of science, really. Scientists shouldn’t really care as much about results, we should be more invested in our methods, and then however the results come out, that’s how they come out.
Nat: Do you have a dream interdisciplinary collaboration or a school that you’d like to work with more?
David: I’d like to collaborate with someone from policy studies. My work has always been quite relevant to that.
I do like collaborating. I worked with some artists to develop a public engagement activity for Green Man Festival. They had some great ideas to communicate our research in really fun and engaging ways that I’d never have been able to come up with. I think the arts and sciences should collaborate more, especially to disseminate knowledge since scientists can be pretty terrible at that.
Nat: If anyone wants to contact you to talk about your work or your dataset, how should they contact you?
By email is fine at david.troy@bristol.ac.uk
In the next Spotlight on Data, Dr Rebecca Barnes will tell us about her unique video and audio dataset of Doctor’s appointments, “One in a million: A study of primary care consultations”.