Digital Humanities meets Medieval Financial Records

Blog by Mike Jones, Research Software Engineer in Research IT, University of Bristol

The purpose of this project was to explore the use of ‘Digital Humanities methodologies’ in analysing an English-language translation of a medieval Latin document. We used data analysis tools and techniques to extract financial data and entities (e.g. people, places and communities) from the translation. This process then enabled the creation of example visualisations, to better interpret and understand the data and prompt further research questions. 

 Primary source 

The focus of the project was a single Irish Exchequer receipt roll from the latter years of King Edward I’s reign (1301–2). A receipt roll holds information on the day-to-day financial dealings of the Crown. It provides a rich source of material on not only the machinery of government but also the communities and people that, for various reasons, owed money to the king. An English-language calendar published in the late nineteenth century exists but was found to be deficient. A full English-language edition of the roll was edited by Prof Brendan Smith (Co-I, History) and Dr Paul Dryburgh (The National Archives) and published in the Handbook of Select Calendar of Sources for Medieval Ireland in the National Archives of the United Kingdom (Dublin, Four Courts Press, 2005). The original document is in The National Archives (TNA), London, with the document reference E 101/233/16. 

Transcript to tabular data 

The starting point was the text published in the Handbook of Select Calendar of Sources for Medieval Ireland. A Python script was used to trawl the text, looking for details of interest, namely dates and payments, and add them to a CSV (tabular data) format. Using the Natural Language Toolkit we attempted to extract entities, such as people and places, using an out-of-the-box Parts of Speech (POS) tagger. The results were not perfect, with some places identified as people, but it was an encouraging starting point. 

In the tabular data, each row recorded a payment, including the financial term, date, the geographic location or other entity they are categorised, the value owed to the Irish Exchequer. Payments, recorded in pounds, shillings, pence or marks, were converted to their value in pennies for more straightforward computation. We also checked our computed totals against those calculated by the medieval clerks of the Irish Exchequer these were one penny out, the clerks having missed some fractions of a penny on 24 May 1302! 

Data analysis and visualisations 

With the data in a tabular format, it could be queried with the pandas data library, and visualised with the Matplotlib and Seaborn visualisation libraries. Querying the data, we were now able to create several visualisations, ranging from summary statistics for the financial year, drilling down to monthly, weekly and daily activity. We were also able to visualise the days the Exchequer sat, compared to days it did not sit due to holidays and feast days.  

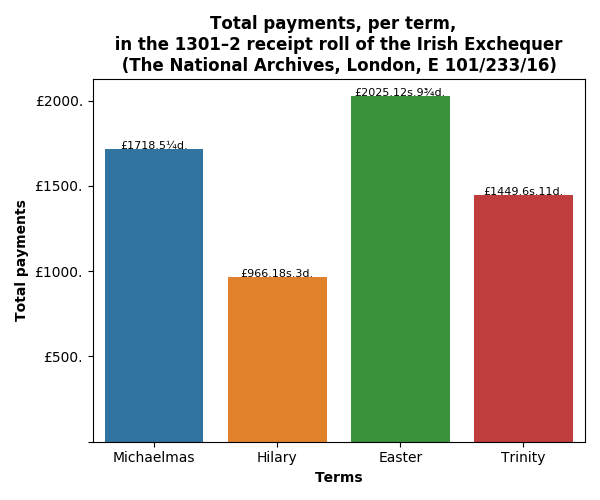
For example, the total value of the receipts for the financial year was £6159.18s.5d. In the following plot we can break-down the payments into the four financial terms: Michaelmas (September–December), Hilary (January–March), Easter (April–June) and Trinity (June–August), as shown in the chart. 

Other plots highlighted the variability of income, the amount of business (number of transactions), and the number of days the Irish Exchequer sat each term. This is illustrated in the following radar plots, where we plot all three variables – total revenue, length of the term and amount of business – with each variable represented as a percentage of the total value for the year. 

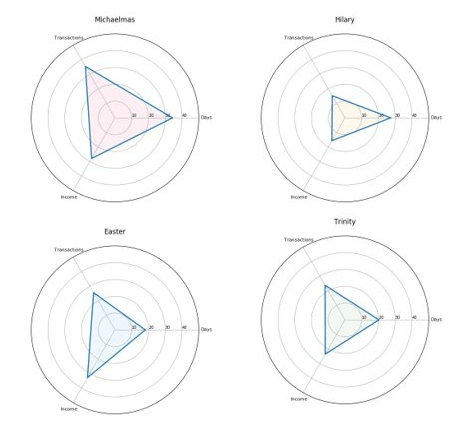
What is immediately striking in these plots is that the Hilary term is relatively long but has the least business and income. In contrast, the Easter term is quite short but provides the most income. These plots confirm what the historians expected – the sheriffs made their proffers to the Exchequer in the Michaelmas and Easter terms and thus were anticipated to be busier. 

Reception and response 

While working on the project, findings and visualisations were shared on social media. This prompted interest and questions from other historians. For example, Dr Richard Cassidy asked (https://twitter.com/rjcassidy/status/1240944622186217472): Was income concentrated in the first week or two of the Michaelmas and Easter terms, from the sheriffs’ adventus, as in the English receipt rolls from the 1250s and 60s?We were able to generate plots that showed in the Irish Exchequer the bulk of the income came in the fourth week and not the second. 

Note: in the tenth week of Michaelmas, the spike in payments against a lower number of transactions is accounted for by Roger Bagot, sheriff of Limerick, returning £76.6s.8d. for the ‘debts of divers persons’; and £100 being returned by William de Cauntone, sheriff of Cork, in forfeited property of felons and fugitives. 

Limitations and research questions 

Clearly there are limits to the analysis, since the project only examined one financial year. It would thus be interesting to analyse trends over time. How does the 1301/2 financial year compare to others in Edward I’s reign? What trends can be seen over the years, decades and centuries? How was the income from Ireland affected by war, rebellion, famine and plague? Are there trends to be gleaned from the different administrations under varying chancellors? Also, does income reflect the changeable effectiveness of English royal authority in Ireland? Can we confirm the ‘decline of lordship’ narratives in the historiography of fourteenth and fifteenth century Ireland?  

Future work 

It is our intention to build on this initial work with the support of external funding. An application has already been made under the AHRC/IRC scheme ‘UK-Ireland Collaboration in the Digital Humanities’ to support a Network to investigate suitable DH approaches to the entire series of Irish receipt rolls, covering the years 1280-1420. Despite being unsuccessful, our application was highly rated and we intend to apply for a major research grant worth up to £1m under the same scheme when details are announced. Furthermore, we are committed to collaborating with Beyond 2022, an ambitious project to create a Virtual Record Treasury of Irish history. Beyond 2022 have commissioned the digitisation of a large number of documents held at The National Archives, London, including the Irish Exchequer receipt rolls. Plans include creating English-language translations of the Irish receipt rolls in TEI/XML, the de facto standard for encoding texts. It will then be possible to construct a pipeline, that builds upon this seed-corn funding work, that results in researchers exploring and formulating research questions around English colonial rule in Ireland and how the Irish interacted with English machinery of government. 

Further Details 

More detailed information about the project can be found in a series of blog posts, and the source code and data are available on GitHub

Jean Golding Institute Seed Corn Funding Scheme

The Jean Golding Institute run an annual seed corn funding scheme and have supported many interdisciplinary projects. Our next round of funding will be in Autumn 2020. Find out more about our Funding opportunities

Decoding pain: real-time data visualisation of human pain nerve activity

Blog post by Manuel Martinez, Research Software Engineer and Dr Jim Dunham, Clinical Lecturer, from the School of Physiology, Pharmacology and Neuroscience at the University of Bristol

We are developing new tools to analyse human pain nerve activity in real time. This will aid diagnosis in chronic pain and enable individualised, targeted treatments.

Some patients with chronic pain have abnormally increased activity in their “pain detecting” nerves (nociceptors). We do not know which patients have this problem and which do not. If we could determine which individuals suffer with these ‘sensitised’ nociceptors, we could treat them more effectively, by giving medicines to ‘quieten’ their nerves.

We record from human nociceptors using a technique called microneurography. Sadly, this technique is only used in research as it is too time consuming and unreliable to use clinically. To bring microneurography closer to the clinic we sought to:

Improve Real-time Data Visualisation

  • Improve the way real-time neural data is displayed by replacing a legacy oscilloscope-like trace with a 4D ‘smart’ visualiser.

Close the Loop

  • Develop and implement automated real-time robust spike detection algorithms.
  • Develop and implement closed-loop dynamic thresholding algorithms to automatically control the electrical stimulus energy.

These developments have the potential to significantly increase experimental efficiency and data yields.

Figure 1 Conceptual set-up for a closed-loop experiment. An electrical stimulus of a predefined intensity is applied to the skin (A). If the stimulus intensity is large enough, the nerve will fire and send a “spike” of activity towards the brain. The electrical activity of the nerve is recorded “upstream” at some distance away from the stimulation site (B). These spikes are digitised and processed in a computer (C) so that they can be visualised in real time to aid in electrode placement. The resulting recordings can be exported for further analysis in third-party software tools (D).

Real-time Data Visualisation

Microneurography allows for nerve activity to be recorded by means of a fine electrode inserted through the skin into the nerve. After insertion into the nerve, the skin supplied by that nerve is electrically stimulated to cause activity in the nociceptors (Figure 1). Recording this activity is difficult; it requires careful positioning of the electrode and is further complicated by the small amplitude of the nerve signal in comparison to noise.

Figure 2A shows the legacy oscilloscope-like visualiser commonly used in microneurography. The signal trace represents the voltage measured in the recording electrode as a function of time. The evoked neural spikes are indicated by green arrows. The large spikes (indicated by the red lighting symbol) correspond to a signal artefact caused by the electrical stimulation system.

“Pain” nerves conduct slowly and therefore have characteristically long latencies. These latencies show good correlation between successive firings. Therefore, accurate electrode placement can be verified by the presence of consecutive spikes of similar latency after the stimulus event.

Figure 2B shows our novel 4D visualiser. Here, the signal amplitude is encoded via colour, with lighter colours representing high amplitudes. This colour scaling can be adjusted in real time by the user. The vertical axis corresponds to latency after the stimulus event and the horizontal axis to a series of stimulus events. Therefore, a constant latency spike manifests itself as a line in this visualiser.

This is a significant improvement over the legacy visualiser as the subtle changes in colour and the alignment between two consecutive spikes can be readily identified by eye in real time. This greatly increases the clinician’s situational awareness and contributes to maximising experimental yield.

Figure 2 Microneurography data recording from the superficial peroneal nerve as seen in the legacy oscilloscope-like visualiser (A) and the novel 4D latency visualiser (B-C). Two units of similar latency can be readily identified and have been indicated with green arrows. A possible third unit at a longer latency has been indicated with a dotted arrow. This third unit is only noticeable in the 4D visualiser as it is below the noise level in the oscilloscope trace.

Closed-loop stimulation control

The electrical energies required to evoke nociceptor activity are not constant. These changes in electrical ‘threshold’ may be useful in understanding why patients’ nerves are abnormally excitable. Unfortunately, balancing signal detection against stimulation energy in the context of real time analysis of small amplitude signals is difficult and primed for failure.

To improve reliability and reproducibility, we have developed a dynamic thresholding algorithm that automatically controls stimulation energy once a unit has been manually identified (i.e. a line can be seen in the visualiser). This is conceptually simple: decrease the stimulation energy until the unit ceases to fire, then increase it until it starts firing again.

In practice, the robust detection of spikes is challenging as existing approaches are only successful in environments with high signal-to-noise ratios (SNRs). To address this, our proof-of-concept algorithm first takes a set of candidate spikes (obtained using a simple threshold crossing method – green points in Figure 2C). Then, these candidate spikes are temporally (latency) filtered so that only those around a small region of interest near the detected track remain. This detection algorithm, despite its simplicity, has shown promising performance on pre-recorded and simulated data and is now ready for testing in microneurography.

Revolutionising human microneurography

We seek to revolutionise human microneurography: bringing it into the clinic as a diagnostic tool; informing treatment decisions and demonstrating ‘on target’ efficacy of new analgesics.

The novel 4D visualiser and automated closed-loop experimental tools developed here will be validated in microneurography experiments in healthy volunteers and then made publicly available in the spirit of open-source research. Additionally, we will integrate more advanced methods of ‘spike’ detection into the algorithm to maximise sensitivity and specificity.

We anticipate our first patient trials of these novel tools within the next 12 months. Our visualiser will enable rapid identification of abnormal activity in nociceptors, paving the way towards data-driven, personalised treatments for patients living with chronic pain.

Contacts and Links

Mr Manuel Martinez Perez (Research Software Engineer, School of Physiology, Pharmacology & Neuroscience)

Dr Jim Dunham (Clinical Lecturer, School of Physiology, Pharmacology & Neuroscience)

Dr Gethin Williams (Research Computing Manager, IT Services)

Dr Anna Sales (Research Associate, School of Physiology, Pharmacology & Neuroscience)

Mr Aidan Nickerson (PhD student, School of Physiology, Pharmacology & Neuroscience)

Prof Nathan Lepora (Professor of Robotics and AI, Department of Engineering Mathematics)

Prof Tony Pickering (Professor of Neuroscience and Anaesthesia, School of Physiology, Pharmacology & Neuroscience)

Jean Golding Institute Seed Corn Funding Scheme

The Jean Golding Institute run an annual seed corn funding scheme and have supported many interdisciplinary projects. Our next round of funding will be in Autumn 2020. Find out more about our Funding opportunities

Mood music – Inferring wellbeing from Spotify

Photo by Morning Brew on Unsplash

Does what you listen to reflect how you feel? And if it did, what would you think about using your music history to track your mood?  

Blog post by Nina Di Cara, PhD researcher, Population Health Sciences, University of Bristol

Our research group, the Dynamic Genetics Lab, previously looked at whether what we do and what we say on social media can be used to measure mood and wellbeing. This Seedcorn Grant, from the Jean Golding Institute, has given us the opportunity to look at the feasibility of a different medium – music streaming.  

Aims

  • Recruit a focus group of students to discuss the acceptability of tracking mood through music streaming behaviours 
  • Build an opensource software infrastructure to collect Spotify data from consenting participants, alongside tracking their mood through frequent mood questionnaires.  
  • Conduct a pilot study to understand whether music listening behaviours were predictive of mood.  

Establishing non-questionnaire measures of mood and wellbeing, especially those that allow us to track mood longitudinally, has many potential benefits. It means that understanding wellbeing does not need to rely on participants trying to remember how they have felt for the past several weeks or months. Continuous non-intrusive measurement of mood could also help identify patterns in response to external events at a personal or population level. These methods could also make it easier for people to track their own moods, and to share recent patterns with mental health professionals. Of course, with new technology like this it is always incredibly important to pair it with an in depth understanding of people’s views on the limitations and acceptability of its development and use. 

Bespoke software for novel application of mental health data science

When the project started in January 2020 we were really excited to get going – the study was a chance to integrate qualitative and quantitative research and build our own bespoke software for this novel application of mental health data science 

The software we are building is a platform that will allow participants to sign up, complete baseline questionnaires, connect their Spotify account and will collect the Spotify data they have agreed to. It will also send them a brief questionnaire several times a day for two weeks that will ask them to report how they are feeling. At the end we will have the two weeks of music listening data from Spotify alongside these mood reports to analyse. As the software will be open source it may even be of use to other researchers, as well as being used for future studies of our own. 

By February we had successfully navigated the first stage of ethical approval and recruited our participant focus group. A few weeks later we held the first of our five planned focus groups, where participants spoke about the acceptability of using music listening data in academic research and compared it to other types of data commonly collected for epidemiological research. The participants also shared their thoughts on how their music listening patterns may, or may not, be indicative of how they feel.  

An opportunity to refine plans

Sadly, just as we were getting started, COVID-19 arrived in the UK. Our focus groups were suspended, and we decided that it would not be ethical to conduct research which requires frequent introspection at a time that a lot of people were struggling to get to grips with lockdown.  

We are pleased to say that now life is starting to return to normal we are able to pick-up where we left off, with a few adjustments! We will be re-starting our focus groups online, and looking to run our pilot study in the Autumn when students return 

Having delays isn’t all bad though – it has meant we have more time to get feedback from other researchers, and more time to spend getting our software right. This should mean that when we do go ahead the study design and tools will have benefitted from those few extra months of refinement!  

How to get involved

If you are a student who is interested in taking part in a focus group, or taking part in the pilot study later this year, get in touch with Nina (nina.dicara@bristol.ac.uk) to receive updates when we start recruiting.  

Jean Golding Institute Seed Corn Funding Scheme

The Jean Golding Institute run an annual seed corn funding scheme and have supported many interdisciplinary projects. Our next round of funding will be in Autumn 2020. Find out more about our Funding opportunities

Building capacity for big data management for Ghana’s developing economy

A Science and Technology Facilities Impact Award (STFC IAA) won by a team from the Physics department in collaboration with the start-up iDAM and facilitated by the JGI will provide hardware and software facilities for high volume data storage and archiving, processing, visualisation, algorithm development and testing for research in academia and industry in Ghana, contributing to the development of data science and digital innovation capability in the country.

Emmanuel Bempong-Manful, Henning Flaecher, Johannes Allotey, Kate Robson Brown

The team (Dr Henning Flaecher, Prof Kate Robson Brown and Prof Mark Birkinshaw) will develop a collaboration with local partners, the Ghana Radio Astronomy Observatory (GRAO), the Development in Africa with Radio Astronomy (DARA) project, and iDAM, a local start-up founded by two Bristol PhD students, Johannes Allotey and Emmanuel Bempong-Manful.

The Government of Ghana is embarking on the digitisation of several areas of the economy, including the passport office, ports and harbours and the energy sector, with the aim to improve services and revenue collection. These developing digital services together with those still to be implemented (e.g., in the digitisation of national IDs, health records, birth and death registry) will produce an enormous volume of sensitive data that requires efficient storage and management. However, despite the looming data volumes and recent advancement in statistical and machine learning techniques for inference and predictive analysis, these techniques are still under-utilised in Ghana.

As the economy grows and evolves through digitisation, and as data volumes increase, these data science solutions will become increasingly useful for quick, efficient and reliable extraction and evaluation of information from the datasets and to support evidence-based predictions.  As a result, there is an urgent need to develop facilities and a skills-based workforce in data analytics that will be capable of manipulating big datasets to make meaningful contributions to the Ghanaian economy. However, these goals can only be achieved if modern computing infrastructure/ hardware and software solutions are available.

This STFC funded project will lay the foundation of a modern computing facility which will be hosted by GRAO and iDAM to provide the technical support and capacity building activities. iDAM has long-term plans to establish a one-stop data management hub to tackle data challenges in Ghana and is currently working with the Ghana Space Science and Technology Institute (GSSTI) and the DARA project to deliver data curation services.

Kakum Park, Nkrumah Museum, GRAO Observatory

This project will address a major societal challenge in the area of big data management in Ghana and aims to contribute to the Sustainable Development Goals (SDGs) through skills development programmes in data management and data science boosting new careers and economic growth and delivering quality data management services to the people of Ghana. The project will share regular updates via the JGI blog. If you would like to know more about this project, and would like to collaborate, please contact us via jgi-admin@bristol.ac.uk.

Bristol Data Week 2020 took place online with data science talks, training and workshops

Bristol Data Week is an annual week-long series of talks, seminars and workshops in data science and data-intensive research, open to both University of Bristol attendees, as well as external individuals and organisations.  

A week of talks, workshops and training in data science  

Talks included the role of data science in the COVID-19 response, data and social change, increasing engagement in your data through visualisations and insights into projects revolutionising healthcare and engineering through machine learning. The Advanced Computer Research Centre (ACRC) team ran training sessions daily as part of the week, including data analysis in Python, deep learning and software engineering. Other sessions included managing sensitive research data and Tableau.  

Taking Data Week Online  

By taking the event online it was possible to accommodate higher numbers of attendees and over the course of the week we welcomed 945 participants attending 13 events via Blue Jeans, Microsoft Teams and Zoom.  Attendees came from across all Faculties at the University of Bristol, other universities nationally and internationally, as well as charities and industry. It was a truly global event, with participants joining from as far afield as Australia, Netherlands, Finland, India, Kenya, Ghana, Turkey, Spain, Morocco, Saudi Arabia, Singapore and United States.  

This is what some of the attendees said:  

“Brilliant experience of #DataWeekOnline so far. Positive of global pandemic is removal of geographical barriers. Delivering engaging content online is no mean feat and @JGIBristol have certainly delivered!”   

“Very enjoyable, just the right speed, appreciate the course notes and You Tube video to look at later for practice and reinforcement”  

“Perfect pace and perfect explanation and support”  

Thanks to everyone involved 

We would like to thank our collaborators, without which Data Week Online 2020 would not have been possible: Advanced Computing Research Centre, Elizabeth Blackwell Institute Health Data Strand, Luna 9, Mango Solutions, MRC Integrative Epidemiology Unit, Population Health Sciences, Tableau, The Alan Turing Institute, The Information Lab and University of Bristol Library Research Services. 

What’s next  

The Jean Golding Institute continue to host regular data science co-working meetings for the remainder of the academic year and coming soon is a new data competition in collaboration with the Food Standards Agency. 

More information  

For slides and films from Data Week Online 2020 please visit Data Week Online 2020