Medfluencers: how medical experts influence discourse about practices against COVID-19 on Twitter

Introduction

This project aims to investigate the role of medical experts on Twitter in influencing public health discourse and practice in the fight against COVID-19.

Aims of the Project

The project focuses on medical experts as the driving force of Network of Practices (NoPs) on social media and investigates the influence of these networks on public health discourse and practice in the fight against COVID-19. NoPs are networks of people who share practices and mobilise knowledge on a large scale thanks to digital technologies. We have chosen Twitter as a focus of our analysis since it is an open platform widely used by UK and international medical experts to reach out to the public. A key methodological challenge that this project seeks to address is to extend existing text analytics and visual network analysis methods to identify latent topics that are representative of practices and construct multimodal networks that include topics/practices and actors as nodes and Twitter affordances as edges of the network (e.g. retweets, @metions). To address this challenge, the aims of this project are:

  1. Build a machine learning classifier of tweets that mention relevant practices in the fight against COVID-19.
  2. Build a machine learning classifier of authors of tweets, which can distinguish between medical experts and other key actors (e.g. public health organisations, journalists).

Results

1. Data Collection

We used the report from Onalytica to identify the top-100 influential medical experts on Twitter.   After receiving academic access to Twitter API, we collected a total of 424,629 tweets from the official accounts of these medical experts with the R package academictwitteR from 01 December 2020 to 02 February 2022.

2. Build a machine learning classifier for relevant practices

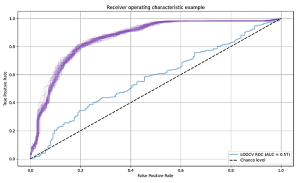
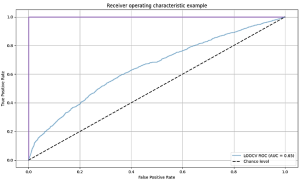
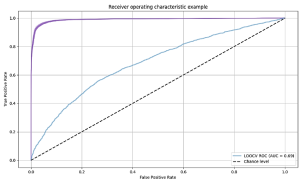
After cleaning the data set, we randomly selected a sample of 1,200 tweets, which was then manually coded as either “relevant” or “non-relevant” by two independent coders and employed to train the Machine Learning classifier. By relevant we mean representative of relevant practices in the fight against COVID-19 (e.g., wearing a mask, getting a vaccine). After training and testing a series of algorithms (support vector classifier, random forest, logistic regression and naïve Bayes), a support vector classifier (SVC) gave the best classification results with 0.907 accuracy. To create the inputs to the classifier, we used a sentence transformer to convert each tweet to feature vector (a sentence embedding) that aims to represent the semantics of the tweet (https://www.sbert.net/). We compared this to a feature vector representing the number of occurrences of individual words in the tweet, achieving lower performance of 0.873 with a random forest classifier. For reference, the baseline accuracy when labelling all classes as relevant is 0.57, showing that the classifier can learn a lot from simple word features. The performance of SVC, random forest and logistic regression was similar throughout our experiments, suggesting that the choice of classifier itself is less important than choosing suitable features to represent each tweet. We applied the chosen SVC + sentence embeddings classifier to the remaining sample of tweets, resulting in 235,320 tweets that were classified as representative of relevant practices.

3. Topic modelling

We employed a topic modelling analysis to gain a better understanding of the types of practices that were discussed by the medical experts. After testing a number of indexes, we found 20 latent topics, were present in our data. We therefore employed a LDA (Latent Dirichlet Allocation) topic model analysis with 20 topics (Figure 1).

Figure 1. Output of Topic Modelling Analysis with 20 Topics

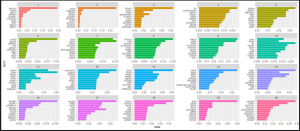
We selected 9 topics related to significant practices linked to the fight against Covid-19:

  • Topic 1 is about vaccines
  • Topics 2 and 16 are about global health policy/practices
  • Topic 6 is about prevention of long covid in children
  • Topic 9 is about immunity (either natural or vaccine-induced) against variants, hence related to COVID-19 public health measures or practices
  • Topic 13 is about reporting of COVID cases and therefore linked to effectiveness of public health measures or practices
  • Topic 18 is about masks (in schools)
  • Topic 19 is about testing
  • Topic 20 is not about a “public health” practice but a scientific practice about sequencing
4. Build a machine learning classifer of authors of tweets

One hundred twitter bios of medical experts were not enough to build the machine learning classifier. Therefore, we upsized our sample by including the bio descriptions of accounts that medical experts followed on Twitter. This strategy allowed us to include bios of users who were not medical experts and therefore differentiate between medical and non-medical “experts” or influencers. We collected the “following” accounts with the R package “twitteR” resulting into a total of 315,589 bios. We randomly selected a smaller sample for the manual coding of these bios (2,000). Following an inductive approach, two independent coders manually coded the bios into labels that classified individuals by their job occupation/profession and organizations by their sector or mission. The label “non classifiable” was used for bios that could not be classified in any professional or organizational category. This resulted into a total of 188 labels which were then aggregated into higher-level categories resulting into a final list of 49 labels.

Future plans for the project

We will use the coded sample of Twitter bios to train a Machine Learning classifier of authors of tweets. We will apply for further funding to improve our methodology and extend the scope of our project, for example, by including more medical conditions, non-English speaking countries, and other platforms in addition to Twitter. We will improve the methodology by identifying experts from a sample of collected Tweets by relevant topics representative of practices and sample and classify authors’ bios from this sample. This will allow us to have a more representative sample of individuals and organizational entities that are active in the public health discourse related to COVID-19 and other medical conditions on Twitter. We will classify practices and then map classified practices and authors onto a network to conduct a network analysis of how medical influencers affect discourse about public health practices on Twitter.

Contact details

For further information or to collaborate on this project, please contact Dr Roberta Bernardi (email: roberta.bernardi@bristol.ac.uk)

Mapping the linguistic topography of Sophocles’ plays: what Natural Language Processing can teach us about Sophoclean drama

Benjamin Folit-Weinberg, A.G. Leventis Postdoctoral Research Fellow (Institute for Greece, Rome, and the Classical Tradition & Department of Classics & Ancient History, University of Bristol) and Justus Schollmeyer, Data Scientist & Programmer

Scholars have long recognized that Sophocles, the great 5th Century B.C.E. tragedian, repeats thematically important words in his plays and that studying these repetitions can offer fundamental insights into his work. At present, however, identifying these repetitions is time-consuming and unsystematic, and the significance of specific repetitions is not always clear. Our project applies Natural Language Processing (NLP) and data visualization techniques to help scholars of Sophocles both identify linguistic patterns more efficiently and rigorously and interpret the significance of these patterns more insightfully.

Seed Corn funding provided by the Jean Golding Institute allowed us to create a feasibility prototype for an NLP and data visualization tool with several functions. The first function is heuristic and identifies the words or word families that appear most frequently in each of the seven fully extant plays of Sophocles. The second function is analytical and calculates how frequently a given word or word family is used in a specific play by Sophocles compared to the remaining six plays. The third function is hermeneutic and depicts the distribution of selected words within a specific play (see diagram below); the chart will ultimately include various overlays that demarcate units of the play and articulate relationships between uses of key words.

The successful development of this feasibility prototype has enabled us to apply for further funding to develop our tool; our goal is to make this available as a common good to anyone with an internet connection, regardless of their institutional affiliation or programming literacy. We are also exploring the possibility of scaling up our tool to address the entire 5th Century Athenian dramatic corpus and other corpora of texts from Greco-Roman antiquity.

For further information, please contact b.folit-weinberg@bristol.ac.uk

Prototype map of use of selected words in the tel- word family in Sophocles’ Oedipus at Colonus

JGI Seed Corn Funding Project Blog 2021: Emily Blackwell

Transferring early disease detection classifiers for wearables on companion animals

Axel Montout, Andrew Dowsey, Tilo Burghardt, Ranjeet Bhamber, Melanie Hezzell and Emily Blackwell

Introduction

Sensor-based health monitoring has been growing in popularity as it can provide insight into the wearer’s health in a practical and inexpensive way. Accelerometer-based sensors are a popular choice and have used been for various applications, ranging from human health to livestock monitoring.

Figure 1: Kiki wearing accelerometry device

Aim of the Project

This project aims to predict early signs of degenerative joint disease (DJD) in indoor cats with the use of accelerometers and machine learning techniques.

Methodology and Results

Dataset

Data points originating from a study investigating DJD in cats were used in this project1. Fifty-five pet cats were equipped with a wearable sensor that collected accelerometery data over a continuous 12-day period.

The Raw data comprised of 57 MS Excel spreadsheets containing the sensor data, along with a metadata spreadsheet, which described the age and joint health of each individual cat, and included an owner-generated mobility score (evaluated by the owner in a series of questions asking them to report changes in the mobility of their cat).

Out of the 57 sensors, five were set up to measure activity counts every millisecond, while the rest collected activity counts every second. For this project, all the activity data were resampled to the second resolution (i.e. each count contains the sum of activity counts within each second) if it was not already at that resolution.

Figure 1. Histogram of Ages. Figure 2. Histogram of Mobility score.

Samples

Using supervised machine learning (SVM)2 requires the building of samples which are composed of an array of features and a ground truth value, which is the value we want to predict. In this case, we decided to solely use activity counts as features and the health score as ground truth.

Accelerometry data for three of the cats were excluded from further analysis, as their respective sensors were calibrated differently compared to the rest of the cats. Although postprocessing approaches could tackle such an issue, this was done as a safeguard to avoid biasing the analysis.

Given the limited number of cats (55), we decided to build multiple samples out of each individual cat. We hypothesised that the effect of degenerative joint disease would reflect more in the activity of a cat when it is performing higher activity behaviour such as jumping, quick running etc. For that reason, we created samples by looking for peaks of activity in each cat trace and selecting a fixed amount of activity data before and after the peak occurred, effectively building a window around the peaks. We fixed the window length to 4 minutes, or 240 seconds, and selected the top 0.001% of peaks, based on the activity count value. With this approach, we were able to generate 10 peaks per cat, giving a total of 550 samples.

Pre-processing

Before feeding in the dataset of peaks, the data was pre-processed (features) to optimise the predictive power of the machine learning classifier. In order to establish which pipeline was optimal, several different pre-processing pipelines were used. Here, only our ‘Baseline’ pre-processing pipeline will be discussed. We initially applied quotient normalisation to the array of activity of the sample, followed by standard scaling.

Quotient Normalisation

This prepossessing step aims to normalise the amplitude of the activity in the samples.

Standard Scaling

This standardizes features by removing the mean and scaling to unit variance. The standard score of a sample x is calculated as: z = (x – u) / s

Figure 5. Visualisation of the average of all healthy and unhealthy peaks. The left column shows the sample activity time series data while the element wise continuous wavelet transform3 is displayed on the right.

Data Augmentation

The initial dataset was augmented (increasing the number of samples) by building permutations of peaks from the initial 550 sample dataset. Permutations of 2 and 3 peaks were built, creating datasets containing 4680 samples (2250 healthy and 2430 unhealthy) and 37440 samples (18000 healthy and 19440 unhealthy) respectively.

Machine Learning

An SVM classifier (RBF kernel) was trained with the datasets described above. To evaluate the prediction performance, we used the leave one out cross-validation method, where we trained the model with all the samples in the dataset, apart from the sample from one cat, which was used for testing. This was done so that all 50 cats were tested against the rest. All samples were pre-processed by applying quotient normalisation and standard scaling before training the SVM.

Results

We used the area under the curve (AUC) of the receiver operating characteristic (ROC) curve to evaluate performances. For the 1, 2 and 3-peaks dataset, a testing AUC of 57%, 65% and 69% were obtained respectively. Using more than three peaks did not improve the results.

Figure 6. ROC curve of an SVM classifier when training on the 1-peak dataset, the AUC is 57%. The purple curve shows the training AUC while the blue one shows the testing AUC.


Figure 7. ROC curve of an SVM classifier when training on the 2-peak dataset, the AUC is 65%. The purple curve shows the training AUC while the blue one shows the testing AUC.


Figure 8. ROC curve of an SVM classifier when training on the 3-peak dataset, the AUC is 69%. The purple curve shows the training AUC while the blue one shows the testing AUC.

Conclusion and Future Plans

Despite the limited amount of data available, a machine learning approach demonstrated promising results in the prediction of early joint disease in cats, with the help of our data augmentation approach. These results suggest that the data within small windows, centred around bursts of activity, contains enough information to discriminate a healthy cat from an unhealthy cat. Further work is currently ongoing to determine which part of the window of activity is most important for prediction. We hope that this will provide a novel insight into how the activity traces of cats with early joint disease differ from unaffected cats, when performing movements involving high activity.

Further Information

For further information about this study please contact Dr Emily Blackwell, Emily.blackwell@bristol.ac.uk

More details about the Bristol Cats Study are available here: http://www.bristol.ac.uk/vet-school/research/projects/cats/

Bibliography

1.MANIAKI, E, Risk factors, activity monitoring and quality of life assessment in cats with early degenerative joint disease. Msc thesis, University of Bristol (2020)

2.CORTES AND V. VAPNIK, Support vector network, Machine Learning, 20 (1995), pp. 273–297.

3.DAUBECHIES, J. LU, AND H.-T. WU, Synchrosqueezed wavelet transforms: An empirical mode decomposition-like tool, Applied and Computational Harmonic Analysis, 30 (2011), pp. 243–261

JGI Seed Corn Funding Project Blog 2021: Dr Zahraa Abdallah

Investigating biomarkers associated with Alzheimer’s Disease to boost multi-modality approach for early diagnosis

Introduction

Alzheimer’s disease is a brain disorder that gradually destroys memory and thinking skills, as well as the ability to perform the most basic tasks. Most people with the disease, those with late-onset symptoms, experience symptoms in their mid-60s. Early-onset Alzheimer’s disease is extremely rare and occurs between the ages of 30 and 60. Alzheimer’s disease is the leading cause of dementia in older people. According to recent studies, 5.8 million people in the United States aged 65 and up have Alzheimer’s disease. Alzheimer’s disease is estimated to affect 60-70 % of the approximately 50 million people worldwide who have dementia.

Aim of the Project

Numerous recent studies leveraged state-of-the-art machine learning techniques to predict biomarkers in Alzheimer’s disease. However, most of these studies focused on medical images of the brain. Despite showing promising results, such images are scarce and typically required at later stages of the disease. We investigate in this project an alternative approach by investigating biomarkers in non-image data instead. Specifically, we explore genomic and protein data for predicting the early stages of Alzheimer’s disease, particularly when combined with other modalities such as EHR (Electronic Health Records) and cognitive tests. The aims of this project can be summarised as follows:

  • Investigate the role of protein and genomic data in detecting Alzheimer’s disease.
  • Explore a multi-modality approach to combine various measures.
  • Assessing ML models for the task and deciding the most suitable choice.

Result

For this project, we use genetic data from Alzheimer’s Disease Neuroimaging Initiative (ADNI) database (https://adni.loni.usc.edu/). In the scope of this project, we only use data from ADNI 2 and ADNI GO cohorts. Subjects are medically confirmed to belong to four categories – cognitively normal (CN), Early Mild Cognitive Impairment (EMCI), Late Mild Cognitive Impairment (LMCI), Significant Memory Concern (SMC) or Alzheimer’s disease (AD). Data is combined with a set of cognitive test results.

Role of APOE in Alzheimer’s disease:

Apolipoprotein E (APOE) is a protein involved in the metabolism of fats in the body. A subtype is implicated in Alzheimer’s disease and cardiovascular disease. APOE has three common forms: APOEe2, APOEe3 and APOEe4. E4 variant is the most common and known to be associated with getting the disease at an earlier age. Approximately 15% to 25% of the general population carries an APOE e4 allele [2].

We examine the E4 variant which has been identified as the greatest known genetic risk factor for late-onset sporadic Alzheimer’s disease (AD) in a variety of ethnic groups [1]. Table 1 shows the distribution of the E4 variate across different stages of Alzheimer’s. APOE4 of zero e4 is the most common in controlled and early MCI. For later stage in LMCI and AD, the most common is the E4 is 1 or more.

Table 1: Distribution of E4 variant in each AD type

Age is also considered a significant factor related to APEO E4; Figure 1 shows the distribution of various types of APOE4 across ages. A higher value of the protein is more common at a younger age. At older ages, 85+years, a smaller value is more common.

Figure 1: Age distribution according to genetic type

Only considering the APOE4 protein and age, the AdaBoost ensemble method is used for predicting the four classes, the average accuracy attained is 41% ± 9%. Using 10-fold cross-validation. This indicated that both factors play an important role in Alzheimer’s disease, yet it is not recommended to use them solely to forecast the condition. We improved the model by adding 4 different Cognitive tests:

  • CDRSB: Clinical Dementia Rating Scale – Sum of Boxes.
  • ADAS11: Alzheimer’s Disease Assessment Scale 11.
  • MMSE: Mini-Mental State Examination.
  • RAVLT_immediate: Rey Auditory Verbal Learning Test (sum of scores from 5 first trials).

Incorporating cognitive tests, the accuracy of the model increased to 76% ± 6%

For analysing the feature’s importance in the combined protein model, we use a forest of trees to evaluate the mean decrease in impurity, along with their inter-trees’ variability represented by the error bars. Through this model, it is confirmed that CDRSB is the most significant factor as shown in Figure 2. In addition to cognitive tests, age is a strong contributing factor too. Education level plays a role in the classification task.

Figure 2: Feature importance in model based on APOE4 and cognitive tests

Role of genetic sequence data:


Figure 3: Visualization of Decision tree based on genetic sequence

We also investigate the role genetic data plays in predicting Alzheimer’s.  The dataset has more than 7000 feature variables describing the genetic constitution of the patients. A simplified Decision tree diagram has been shown in figure 1 which highlights the available actionable paths.  LOC5778 and LOC 2303 are the most significant according to the decision tree information gain score.

We focused on developing prediction models by taking only the top 50 genetic features. Using the genetic features, the classifier achieves only 41% ± 6% accuracy. Combining genetic features with the other features (APOE4, EHR, cognitive tests and MRI tests) shows an increase in accuracy. Various models are tested, and accuracy is shown in Figure 4. Tree-based methods are the best for this task, AdaBoost is on the top of the list with an average accuracy of 71% followed by Decision Tree at 68%.

Figure 4: Comparison of accuracy in different ML models

We have learnt a few lessons working through this project, we summarise them as follows:

  • A combination of modalities is the best approach for predicting Alzheimer’s.
  • Cognitive tests play a significant role in guiding protein and genomic data analysis.
  • Tree-based models showed the best performance for this task.

Future aims for the project include the following

The Alzheimer’s Disease Neuroimaging Initiative (ADNI) database’s impending phase 3 will add fresh patient records to the dataset. We aim to expand this work to include more samples for studies and challenge more hypotheses and unknown biomarkers for Alzheimer’s disease. More in-depth analysis into the role of apolipoprotein E4 in the disease progression. Also, women seem more likely to develop AD than men [3]. The reasons for this are still unclear and need to be investigated further. Other contributing lifestyle factors can be studied more in our future work.

This project emphasised the importance of a multi-modality approach for Alzheimer’s classification.  In our future work, we aim to incorporate additional modalities such as PET scans and MRI images. Whereas the sample size increase, we aim to utilise deep learning approaches, especially for image-based modalities.

References:

[1] Bogdanovic, B., Eftimov, T., & Simjanoska, M. (2022). In-depth insights into Alzheimer’s disease by using explainable machine learning approach. Scientific Reports12(1), 1-26.

[2] Kavitha, C et al. “Early-Stage Alzheimer’s Disease Prediction Using Machine Learning Models.” Frontiers in public health vol. 10 853294. 3 Mar. 2022, doi:10.3389/fpubh.2022.853294

[3] Bachman, D. L. et al. Prevalence of dementia and probable senile dementia of the Alzheimer type in the Framingham study. Neurology 42, 115–19 (1992).

Contact details and links

Harshit Maheshwari, Data Scientist vk20457@alumni.bristol.ac.uk

Dr Zahraa Abdallah Zahraa.abdallah@bristol.ac.uk, Lecturer in Data Science, Engineering Mathematics Department, University of Bristol

JGI Seed Corn Funding Project Blog 2022: Brunel’s Networks – Interactive

Figure 1. The physical real-world exhibit in the SS Great Britain, as a result of this project.

Brunel’s Networks – Interactive

Maria Pregnolato, Lecturer in Infrastructure Resilience, University of Bristol

James Boyd, Head of Research, Brunel Institute/SS Great Britain Trust

Christopher Woods, Head of Research Software Engineering, Advanced Computing Research Centre, University of Bristol

Brunel’s Networks – Interactive has created a physical real-world exhibit of the online network graphing project Brunel’s Networks. The project uses the archives of the Brunel Institute, a collaboration of the SS Great Britain Trust and University of Bristol, to digitally map the groups of individuals and working I.K. Brunel and major 19th century engineering innovations. This first project was developed as a web tool and was missing a physically interactive display. This JGI Seedcorn funding has provided the resources to create a physically interactive experience, which is now installed and in use at the SS Great Britain site (Figure 1).

By uploading the original code of the network graphing into a stable, non-networked (!) unit, the interactive experience can run continuously in a robust console, helping visitors to the SS Great Britain site understand the history of engineering through innovative data visualizations. The console was presented at the JGI showcase event in small table-top form in June 2022, and received positive feedback from visitors, public use. More feedback of the large-scale interactive exhibit will be evaluated during August, allowing the project researchers to understand how data visualisations help the public to understand the past, and the potential of STEM (e.g. programming) behind activities.

Public evaluations from Brunel’s Networks – Interactive will inform the ways in which the SS Great Britain Trust uses digital interactives and data visualizations in future exhibit use – a critical issue in developing contemporary visitor experience and public engagement. This interdisciplinary project combined historical research from the museum with research software engineering from the University, to improve the use of data visualisation in historical analysis, and to use data visualisation as an interpretive museum tool.