The University of Bristol's central hub for data science and data-intensive research, connecting a multidisciplinary community of experts across the University and beyond.
The Turing Way is a handbook to support students, their supervisors, funders and journal editors in ensuring that reproducible data science is “too easy not to do”. It will include training material on version control, analysis testing, and open and transparent communication with future users, and build on Turing Institute case studies and workshops. It is openly developed and any and all questions, comments and recommendations are welcome at the GitHub repository: https://github.com/alan-turing-institute/the-turing-way or in the gitter chat room: https://gitter.im/alan-turing-institute/the-turing-way
The Turing Way team are running a series of workshops for researchers, software engineers and others interested in reproducibility with some support for travel/childcare available on request
Boost your research reproducibility with Binder
If you are looking for an easy way to share your code with others, without worrying about the computational environment they’re running or installing a long list of requirements, then Binder might be the solution for you. Binder allows you to share your software with others in the form of a single clickable link, making it easier for users and removing the need for you to worry about supporting lots of different platforms.
During this free workshop The Turing Way team will discuss reproducible computing environments, show examples of others’ projects in myBinder.org and help you learn how to prepare a binder-ready project. At the end of the workshop you will be able to take some of your own content (in a R or Jupyter notebook, or scripts that can be run in the terminal) and prepare it so that it can be used by others on myBinder.org.
This workshop is for people who are:
Interested in reproducibility, containers, Docker or continuous integration;
Already familiar with R Markdown or Jupyter notebooks;
Looking to communicate their research more effectively.
Funders and publishers are beginning to require that publications include access to the underlying data and the analysis code. Researchers can be supported in doing this through myBinder.org which allows you to share your software with others in the form of a single clickable link, making it easier for users and removing the need for you to worry about supporting lots of different platforms. This is a huge step forward in terms of supporting reproducibility but the public Binder instance, myBinder.org, requires all code and data to be fully open, and computational power and data storage is limited. One solution to this is to host your own BinderHub locally, allowing you to control who has access to code and data and to provide greater computational power.
During this free workshop The Turing Way team will demonstrate how to build your own BinderHub on Microsoft Azure cloud computing resources. They will help you get started with building a BinderHub on your institution’s computing platform and discuss the challenges of maintaining a BinderHub. At the end of the workshop you will know why this would be a useful resource for your team, and will know where to look for help and support building your institution’s BinderHub.
This workshop is for Research Software Engineers and IT staff who are:
Interested in reproducibility, containers, Docker or continuous integration;
Already familiar with Binder and R Markdown or Python for data science;
Interested in setting up their own local BinderHub.
In the Spotlight on Data blog posts, the JGI interviews the owners of datasets available on the University of Bristol’s data.bris platform. We want to showcase the great research that goes on at the University and help bring people’s attention to datasets which could be reused in new and exciting ways.
Rebecca Barnes is a Senior Research Fellow in Applied Conversation Analysis in the Bristol Medical School. She studies communication in medical care.
In this, the second blog post, Natalie Thurlby, Data Scientist at the JGI, talks to Dr Rebecca Barnes about being a data steward of sensitive data, the benefits of sharing data, and what can be learned from patients’ interactions with their doctors. Our conversation is centred on the unique ‘One in a Million: A study of primary care consultations’ dataset.
Nat: Could you tell us a little bit about the dataset on data.bris?
The One in a Million primary consultations archive came out of a study funded by the National Institute for Health Research School for Primary Care Research. The original study team consisted of myself and colleagues Chris Salisbury, Matthew Ridd and Marcus Jepson in the Centre for Academic Primary Care. The study was named ‘One in a Million’ because we know that around one million patients visit a GP every day in England, but not much is known about what actually happens during those visits. The dataset contains around 300 high quality video recordings of medical consultations with permissions for reuse, plus verbatim transcripts and linked demographic, survey data and medical record entries.
The video recordings were collected in Bristol and the surrounding area in twelve different GP practices – six in areas of high deprivation and six in areas of low deprivation. Across those practices, we recorded medical consultations between 23 different GPs and unselected adult patients – those who had an appointment at the practice on the day of filming and who were happy to take part. We received extra funds at the end of the study from the South West GP Trust that enabled us to code the consultations data for all the different problems and issues that were discussed. This has added considerable value to the dataset.
In addition to capturing the basic data on patient, GP, and practice characteristics, we asked patients to fill out three surveys: one immediately before they went in to see the GP, one immediately after they came out, and a follow-up survey ten days later. The GPs also filled out a survey for us and a brief checklist after each recording. We also have data about the information entered in the electronic health record, and any related future visits that patients made up to three months later.
Nat: Could you briefly explain how your research methods influenced the type of data that you collected?
I’m an applied conversation analyst which means that I work with recordings and detailed transcripts of naturally occurring talk between people – real life events as they happen – in my case medical encounters between patients / carers and health care professionals. This allows me to understand how the everyday tasks and goals of the medical consultation are jointly accomplished, and opens a window to the challenges and socio-medical dilemmas faced by professionals and patients along the way. This is different to working with say interview or focus group data, where people might talk about an event and what they remember happening.
I knew that this dataset would be of interest to anyone interested in communication in medical care and therefore wanted to make sure that the video recordings were the highest quality we could get. We used high definition cameras with wide angle lenses so as to capture all parties to the interaction. For an interaction researcher, when parties are co-present, video data is the ‘gold standard’ as it allows you to capture talk, bodily conduct and use of material and digital resources.
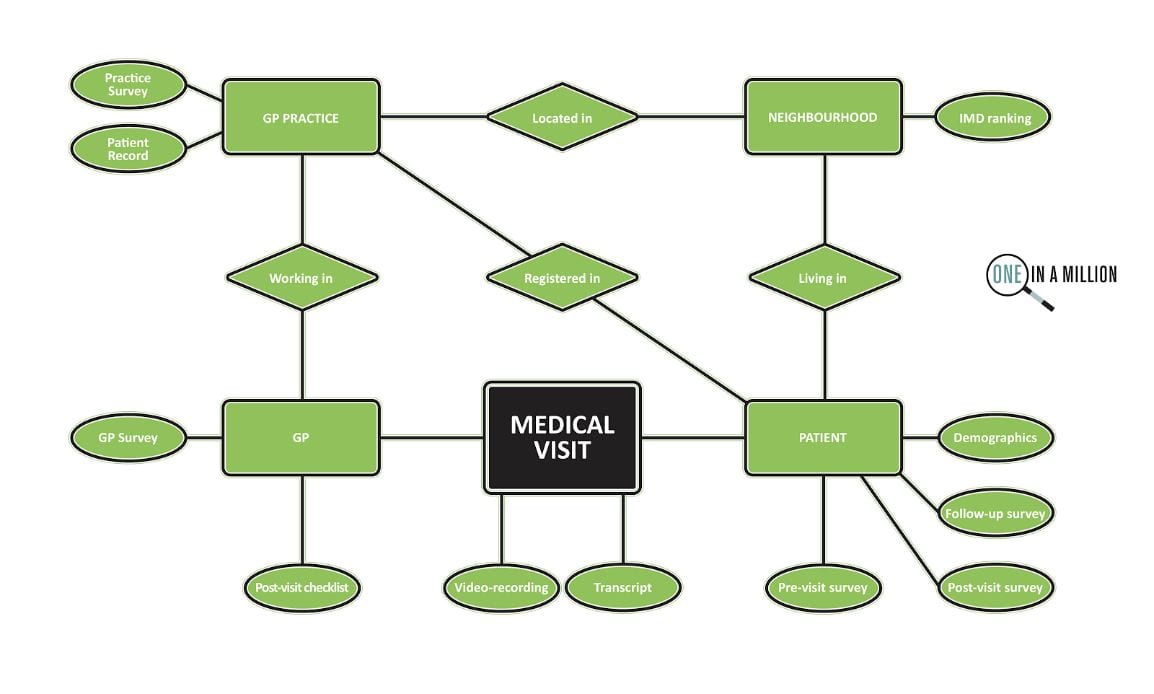
Visual representation of the data in the ‘One in a Million: A study of primary care consultations’ dataset.
Nat: What was your initial research on the dataset and how does that link to your motivation for creating the dataset?
At the time I was interested in the different ways that GPs were recommending drug treatments to patients during medical visits. I needed to collect as many cases of routine treatment planning activity as possible, and to be able to see the extent to which patients were involved. I was working on a cross-national study with colleagues at UCLA comparing treatment recommending practices in US and UK primary care consultations. This work resulted in a Special Issue in Health Communication.
During the study we coded all the different types of treatment recommended. I noticed that there was a difference between drug treatment recommendations and self-care treatment recommendations. Self-care treatment recommendations were more likely to be delivered by GPs as optional and were less likely to receive clear acceptance from patients. At 10 days, patients were also less likely to recall a self-care treatment recommendation. We also compared how often self-care treatments were recorded in the medical record compared to drug treatments, and there was quite a disparity there, which is concerning since it removes the opportunity for GPs to follow up on how patients are getting on.
At the same time, a key motivation for the project was to set up the archive. One of the reasons I did this was to make medical consultations data available for other researchers who might really want to work with this kind of data, but might not be in a position to collect such a large dataset themselves. I’m very passionate about improving communication in medical care, and I didn’t want research on real consultations data to die out because of how difficult it is to collect the data.
Nat: How was the process of organising the collection of all of this data, given that it’s so sensitive?
Gaining a favourable NHS ethical opinion to do this felt like a huge challenge, but I love a challenge! I did a lot of work in advance researching whether anyone had done this kind of thing before, the ethical and legal issues of gaining consent for future reuse, and how to keep the data safe. We tried to strike a balance between making sure that we had really robust systems in place, to keep it safe, and supporting the data being reused for as many different projects as possible
During this time, I visited the UK Data Archive at the University of Essex who provide access to the UK’s largest collection of social and economic data. Luckily enough I met Debra Hiom (who now heads up
Exploring what can be learned from patients’ interactions with their doctors.
data.bris) there. Some time after, I was talking to her about what I was planning to do and she had just set up data.bris and it felt like that was the perfect place to keep it. We worked out the process in advance to make sure that access to the data would be controlled and appropriately managed. The dataset can only be used by bona fide researchers (no commercial use) with NHS ethical approval.
As a team, we wanted to enable the dataset to be useful to as a wide a range of researchers as possible. We surveyed some key people in UK academic primary care, asking them what sort of information and measures would be most useful to collect for a range of different projects.
Nat: Is there anything you’d like to share about the process of sharing research data?
I continue to feel inspired by sharing this data. There is the feel-good factor of being able to help other people access ‘hard to reach’ data, but I also think it’s the most ethical thing for researchers to do, not only for transparency, but also to maximise the value of the data. It takes a lot of planning, researcher time and money to collect, and can be quite burdensome for patients and health care professionals.
I’m also genuinely excited to see how other users are working with the data in different ways to answer different research questions. It’s a bit like having an extended family! The other really great thing for me as a researcher is that the datasets here are given their own DOI (Digital Object Identifier), so at some point in the future I’ll be able to track the impact. It’s been easy in the past not to think of data as a resource in that way.
The data.bris team have been fantastic. I really recommend them, they’ve been SO helpful!
Nat: Were there any particular challenges for you in working with this dataset?
We wanted to work with high definition video to maximise image quality, but of course that means huge file sizes. So learning about the best ways to transfer, store and process it was a bit of an eye opener, really.
To prepare it for reuse, we have had to go through every consultation and anonymise any mention of names, addresses, place names… (Nat: I bet that was a big task!) Yes! In fact, it’s partly still ongoing. So, we’ve had to upskill in terms of video editing and get a computer that’s robust enough to be able to manage those huge file sizes.
One thing that we’re doing is watermarking any videos that we release to researchers with a unique user ID, which makes releasing the data feel that bit safer. It’s quite time consuming to watermark every video before we release them to people, but the videos are our precious cargo.
Nat: On the last Spotlight on Data blog post I highlighted how data.bris could be used to store open data, and obviously that’s not appropriate for this dataset. Could you explain what about the data.bris archive made it a good choice for a dataset like yours?
Every request usually comes to me first, so I get to talk to prospective users and make sure we have what they need to answer their research question. If their proposal is funded they put in a formal request that is independently scrutinised by the University Data Access Committee. To help protect our participants, we also built in that if anyone else wanted to use it, then they’d have to have an NHS ethics approval in place and we also knew that we’d have a Data Access Agreement which an institutional signatory would have to sign to keep the data safe (agreeing that they’d only use the data for what they specified in their ethics application and to agree to our conditions of use etc).
Because the participants have already given consent to reuse, further NHS ethical approval to use the archive is by proportionate review (a shorter and quicker process). We’ve been up and running for a number of years and I’m happy to say that every ethics application for reuse so far has been successful.
Nat: What’s the timeline or process for getting access to the data, for anyone who might be interested?
They should email me at the dedicated email address for the archive (one-in-a-million@bristol.ac.uk), I can then search the data to figure out if we can help them. So, for example, I can see how many relevant recordings we might have in the dataset for that particular area, and let them know if anyone’s already done or is doing the same thing. I also write them a letter of support for their grant application and they can cite our data paper.
The longest part of the process is usually them getting their funding, but after they’ve got that they put in their ethics request, and that can be turned around within a couple of weeks.
Then they put in a request online via data.bris, and show proof of ethical approval and their project protocol. The data access committee reviews the application, and since they’ve done a number of applications for our dataset now, that usually goes quite smoothly.
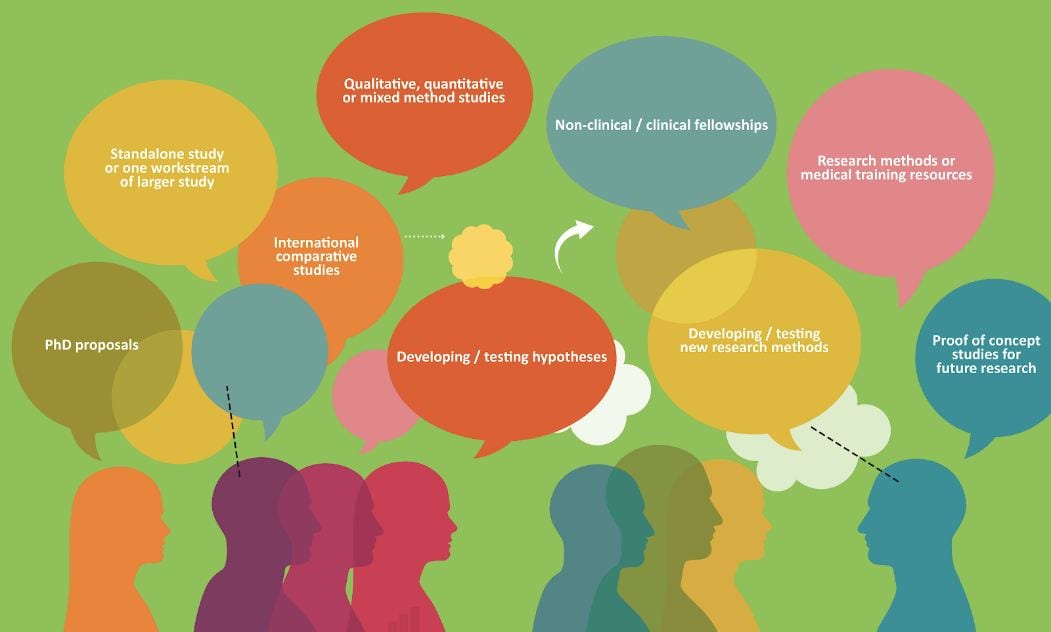
Potential uses for the dataset.
Nat: How has the dataset been used so far?
It’s been used by a number of people from different countries and backgrounds, who are at different stages of their academic career including PhD students, trainee clinicians coming into academia for short projects, and established non-clinical academics. We’ve got around twelve current users at the moment doing a really wide range of studies and we continue to have new interest. In the last month, we’ve had three new requests, so I think word is really getting around!
We also sought permission from our participants to use the data for teaching. I’m already using it for a course that I teach, and we’re hoping to be able to use the dataset as a resource for teaching undergraduate students in Bristol Medical School, creating anonymised vignettes from real cases, which we think will make a difference to their learning.
Nat: What’s next for the dataset?
Right from the start, I always hoped that we would grow the archive to include other types of primary care encounters. I’m currently working on a new study about the management of common infections in out-of-hours (rather than in-hours) primary care, and hope that participants will be willing for us to deposit some of this new data in the archive. That’s really interesting data because it takes place on the telephone, in primary care centres and in patients’ homes, and will include recordings of encounters with a wider range of health professionals such as nurses, paramedics and pharmacists. We begin data collection in March.
Nat: Do you have a dream future use for or collaboration for the data that you’d like to see happen in the future?
One thing I’d really like, that I was hoping at the beginning, is that it would enable international comparative studies and we’re getting closer to that. We’ve inspired a number of other people in other countries to collect similar data and we’ve shared a lot of our processes to enable other people to do that.
Myself and Barbara Caddick who supports the archive, have also become really interested in ways which we can engage the public with our data and we’ve just started to explore the possibilities of working with arts practitioners to enable that. We’ve done some initial scoping work with a composer called Jenny Bell, who works with fragments of transcripts from recorded interviews to build a cappella pieces of music. We want to build a small piece, representing our common shared experience of going to see the doctor. We’d like to incorporate some of the familiar ambient sounds of the doctors: the blood pressure cuff being pumped up, the beep of the thermometer… Then it could perhaps be shared on the radio, or as a physical performance, maybe even in waiting rooms!
Nat: How interdisciplinary has the research been so far and are there any schools or faculties that you’d like to collaborate with more?
So far, it’s been health-related, either clinicians or social scientists, but I’m excited about all the possibilities. We have had some interest from people working in AI, but up to this point they’ve been commercial companies rather than researchers, so we haven’t been able to do that yet. I’d like to attract some more data nerds! One thing that’s been untapped is looking at the non-verbal communication. That would be really exciting to have a look at.
We’ve just recently got some funding from the Brigstow Institute on a project with Genevieve Lively from the Dept. of Classics and Ancient History here at the University of Bristol looking at patient narratives and we’ll be working with a storyteller as part of that work.
Nat: And if anyone wants to get in contact with you, to talk about possible collaborations or uses of the dataset, how can they get in touch?
They can contact me at one-in-a-million@bristol.ac.uk and I’ll be happy to tell them more about the dataset and answer any questions. They can also find more information here:
In the next Spotlight on Data, Dima Damen will tell us about a unique egocentric video dataset of people cooking in their homes,EPIC KITCHENS.
In our new blog feature, Spotlight on data, the JGI interviews the owners of datasets available on the University of Bristol’s data.bris platform. We want to showcase the great research that goes on at the University and help bring people’s attention to datasets which could be reused in new and exciting ways.
Dr David Troy is a research associate in population health. His PhD focused on determining the efficacy of choice architecture interventions that can reduce population alcohol consumption. David’s research is currently focused in the public health area, specifically risk behaviours among young people and young people’s mental health
In our first blog of the series, Natalie Thurlby, Data Scientist at the JGI, talks to Dr David Troy about open science and how quickly people drink lager with respect to the “Effect of glass markings on drinking rate in social alcohol drinkers” datasets, one and two.
Nat: Could you tell me about the research project behind the dataset?
David: The project was looking at the effect of glass markings on the speed of drinking alcoholic beverages. There were two studies involved in the project.
In the first study [relating to the first dataset], 160 people were recruited and half of them (80 people) received a curved glass with a marker (yellow tape) showing the midpoint in terms of volume, and the other half received the same glass without the marker. The hypothesis was that the people drinking from the glass with the marker would drink slower since they would be more aware of the speed that they were drinking. It turned out that there was no difference in drinking times between the two groups. Angela Attwood in partnership with Marcus Munafò designed the studies and I analysed it.
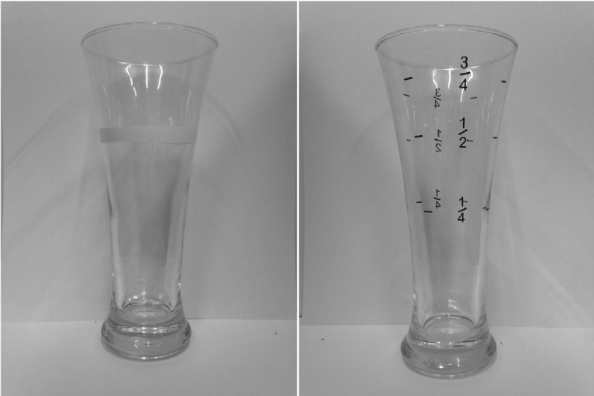
The second study (relating to the second dataset), black markings with numerical labels denoting the volume were placed at one quarter, one half, and three-quarter points. It was published in European Journal of Public Health. We found modest evidence for an effect with the new study design.
Nat: Asking the important questions here: what brand of lager did they drink?
David: In the first study, there were two strengths of lager, both cheap small bottles of Lidl beer. In the second study, I think it was Budweiser.
Nat: And what analysis did you do on the data?
David: We used linear regression in both studies. Total drinking time data were analysed using multiple linear regression including glass marking (unmarked, marked) and lager strength (low, standard) as predictor variables and an interaction term of glass marking and lager strength.
Nat: What were the particular challenges of this project and what was your favourite bit?
David: Interpreting the findings of study 2 was quite challenging because we had to interpret the results in quite a nuanced way. We had a p-value of 0.072, which is above 0.05, which most people talk about as the cut-off for being significant. I don’t believe in the dichotomy of significance and non-significance, but not everyone agrees with that. In the end, we said there was modest evidence for an effect, which doesn’t say “there’s nothing here”, we didn’t say “there’s great signal here”.
My favourite bit was probably testing the last participant because it was 160 people and took 2 or 3 months to test them all. Publishing the work and talking at conferences was also really nice of course.
Marked and unmarked glasses as used in study two, image from Troy, David M., et al. “Effect of glass markings on drinking rate in social alcohol drinkers.” European journal of public health 27.2 (2017): 352-356.
Nat: Why did you decide to put the data in the repository?
David: It helps me be a better scientist. That’s probably the number one reason; if you know that your data is going to be accessible by everyone, then you’re going to make doubly and triply sure that your data is right and is labelled correctly and clearly.
If other people come across the paper and want to verify my findings, then other people can download my data, run their own analysis on it and see if they get the same results or if I’ve made any mistakes. That would be great! That’s what we’re trying to do in science, we’re trying to do experiments that are able to stand up under scrutiny. Open data helps us do that.
Another use is if someone was doing a meta-analysis of alcohol-related or glass-related studies, they could get to the base data and calculate whatever they needed from that.
Those are personal benefits, but a benefit for science is that it’s also easier to spot fraud if you have the base data, so if open data was the norm, labs under scrutiny wouldn’t be able to say they’d lost the file, etc..
Nat: I’m wondering if someone could use it to do a good data visualisation. Is there anything that you’d like to see?
David: I saw a good one (not of my data) of how much teenagers are drinking, displayed in pint glasses. You’d need some graphic design skills for that, which I don’t have. I bet people could come up with some cool stuff.
Nat: Do you have any tips for other people who’d like to put their data on data.bris?
David: If you want to make your data open access, make sure you ask your participants in advance. That didn’t happen with the first study, so people have restricted access to that dataset. When I put my data on data.bris, I put my data sheet in the .csv format so it can be opened in many different programmes. I do the same for the data dictionary which explains clearly what variables are in the data sheet. I briefly explain the study in a txt file and I’ve started putting the study protocol, information sheet and consent form in the repository as well. People can search for my name on the data.bris site and download the files to use as templates if they like.
Nat: How do you think the concept of open research will affect your field? Has it already made a difference?
David: It’s probably too soon to have a real impact on my field or any field, but I think it’s going to be the default way to do science from now on. Everyone should be publishing their journals in open access papers and pre-registering their protocols, especially if your work is publicly funded like mine was. The people who paid for my research should be able to read it.
I think open science is definitely going to make science more rigorous. You’re not going to be able to get away with some of the shenanigans that researchers got away with in the past, for example, Brian Wansink encouraging his students to re-analyse a dataset in lots of different ways in order to get a smaller p-value (i.e. HARKing and p-hacking).
Nat: How else did you make your research “open”?
David: Study 1’s protocol wasn’t preregistered. That study was designed before I started my PhD. I preregistered the protocol for Study 2 on the Open Science Framework and submitted it to an open access journal, as well. I do want to a registered report, I haven’t done that yet. And I haven’t published any syntax or code yet either. I felt like it was too simple for my PhD analysis, but in the spirit of transparency, I should probably have done that.
Nat: We can all improve our open research ways! What are you doing next?
David: I’ve just started a new role in population and health sciences, it’s a training role for two years to learn a lot of different new skills and I’m doing a couple of new things.
The main thing I’m doing at the moment is secondary data analysis on the ALSPAC dataset. I’m looking at risk-taking behaviours in young people measured at ages 12, 14, 16 and 18 and then we’re going to analyse the patterns of risk-taking behaviours as they get older. I’m hoping to do a registered report with this one – there are some journals that accept secondary data analysis.
Green Man Festival
Nat: I love the idea of registered reports! I hope they become widespread in more fields.
David: Yeah, they are the gold standard of science, really. Scientists shouldn’t really care as much about results, we should be more invested in our methods, and then however the results come out, that’s how they come out.
Nat: Do you have a dream interdisciplinary collaboration or a school that you’d like to work with more?
David: I’d like to collaborate with someone from policy studies. My work has always been quite relevant to that.
I do like collaborating. I worked with some artists to develop a public engagement activity for Green Man Festival. They had some great ideas to communicate our research in really fun and engaging ways that I’d never have been able to come up with. I think the arts and sciences should collaborate more, especially to disseminate knowledge since scientists can be pretty terrible at that.
Nat: If anyone wants to contact you to talk about your work or your dataset, how should they contact you?
Unsurprisingly, at the Jean Golding Institute, we love data. Datasets are not only an intrinsic part of research, they are also an important (and REF-able!) output. By publishing research data, we invite people to build on our research and we also make our own results easier to reproduce. At the University of Bristol, this is made easier by having access to the data.bris research data repository.
In the coming year, the Jean Golding Institute would like to celebrate researchers at the University of Bristol by shining a spotlight on their data.bris datasets. We’ll be doing this in the format of interview blog posts with the researcher.
We’re looking forward to sharing our first Spotlight on Data blog post in January, when we will be talking to David Troy about lager and open research and his datasets on “Effect of glass markings on drinking rate in social alcohol drinkers”. Take a look at study one and study two via data.bris.
Blog piece written by Natalie Thurlby, Data Scientist at the Jean Golding Institute.
We were really impressed with the quality of applications for this year’s round of funding and are very pleased to announce the JGI Seed corn fund winners for 2019:
Peter Bennett, Robert Arbon & Alex Jones for their project ‘Audio-visual display of protein dynamics using deep learning and classical composition’
Catherine Dodds & Peter Keogh for their project ‘ReUsing Qualitative Datasets to Understand Shifts in HIV Prevention 1997-2013’
Chris Adams, Dima Damen & Natalie Fey for their project ‘EPIC Lab: Generating a first-person (egocentric) vision dataset for practical chemistry – data analysis and educational opportunities’
David Sweeting, Hen Wilkinson, Bobby Stuijfzand & Derek Edwards for their project ‘From conflict to collaboration: visualizing shifts in group energy to support creativity’
Matthew Avison for his project ‘Multi-task learning for antimicrobial resistance’
Stephen Chuter, Jonathan Rougier & Jonathan Bamber for their project ‘Interactive visualisation of Antarctic mass trends from 2003 until present’
Additionally, we have agreed to support the following workshops:
Rachel Denholm, Rupert Payne, Jonathon Lawry & Philip Harfield for a workshop on ‘Optimising the analysis of routine administrative health records: making better use of data science methodologies’
Ivan Palomares Carrascosa for a workshop on ‘RESULTS: REcommender Systems for engaging Users with healthy Living habiTS’
Keep an eye on the JGI website and blog for updates on these projects throughout 2019.
Take a look at some of the other projects the JGI have supported – Projects

 The Turing Way is a handbook to support students, their supervisors, funders and journal editors in ensuring that reproducible data science is “too easy not to do”. It will include training material on version control, analysis testing, and open and transparent communication with future users, and build on Turing Institute case studies and workshops. It is openly developed and any and all questions, comments and recommendations are welcome at the GitHub repository: https://github.com/alan-turing-institute/the-turing-way or in the gitter chat room: https://gitter.im/alan-turing-institute/the-turing-way